
Across the recent three months, 4 analysts have shared their insights on Ashland ASH, expressing a variety of opinions spanning from bullish to bearish.
Summarizing their recent assessments, the table below illustrates the evolving sentiments in the past 30 days and compares them to the preceding months.
| Bullish | Somewhat Bullish | Indifferent | Somewhat Bearish | Bearish | |
|---|---|---|---|---|---|
| Total Ratings | 1 | 2 | 1 | 0 | 0 |
| Last 30D | 0 | 1 | 0 | 0 | 0 |
| 1M Ago | 0 | 0 | 0 | 0 | 0 |
| 2M Ago | 1 | 1 | 1 | 0 | 0 |
| 3M Ago | 0 | 0 | 0 | 0 | 0 |
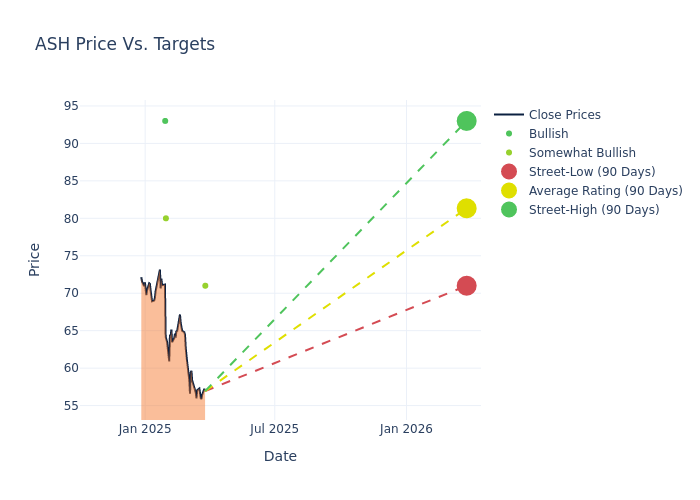
Analysts provide deeper insights through their assessments of 12-month price targets, revealing an average target of $78.0, a high estimate of $93.00, and a low estimate of $68.00. A decline of 6.59% from the prior average price target is evident in the current average.
Diving into Analyst Ratings: An In-Depth Exploration
The perception of Ashland by financial experts is analyzed through recent analyst actions. The following summary presents key analysts, their recent evaluations, and adjustments to ratings and price targets.
| Analyst | Analyst Firm | Action Taken | Rating | Current Price Target | Prior Price Target |
|---|---|---|---|---|---|
| Jeffrey Zekauskas | JP Morgan | Raises | Overweight | $71.00 | $68.00 |
| Jeffrey Zekauskas | JP Morgan | Lowers | Neutral | $68.00 | $81.00 |
| Michael Sison | Wells Fargo | Lowers | Overweight | $80.00 | $90.00 |
| Joshua Spector | UBS | Lowers | Buy | $93.00 | $95.00 |
Key Insights:
- Action Taken: Analysts frequently update their recommendations based on evolving market conditions and company performance. Whether they 'Maintain', 'Raise' or 'Lower' their stance, it reflects their reaction to recent developments related to Ashland. This information provides a snapshot of how analysts perceive the current state of the company.
- Rating: Analyzing trends, analysts offer qualitative evaluations, ranging from 'Outperform' to 'Underperform'. These ratings convey expectations for the relative performance of Ashland compared to the broader market.
- Price Targets: Analysts gauge the dynamics of price targets, providing estimates for the future value of Ashland's stock. This comparison reveals trends in analysts' expectations over time.
For valuable insights into Ashland's market performance, consider these analyst evaluations alongside crucial financial indicators. Stay well-informed and make prudent decisions using our Ratings Table.
Stay up to date on Ashland analyst ratings.
All You Need to Know About Ashland
Ashland Inc is a world-wide specialty materials company that serves a wide range of industrial markets. The company has a business-centric operating model and is organized into four distinct segments: life sciences, personal care, specialty additives, and intermediates. Key customers for the firm include pharmaceutical companies and manufacturers of personal care products, food and beverages, and nutraceuticals and supplements. The life sciences segment derives maximum revenue. The company generates its sales from North America, Europe, Asia Pacific, and Latin America, and Others.
Financial Milestones: Ashland's Journey
Market Capitalization Perspectives: The company's market capitalization falls below industry averages, signaling a relatively smaller size compared to peers. This positioning may be influenced by factors such as perceived growth potential or operational scale.
Revenue Growth: Ashland's revenue growth over a period of 3 months has faced challenges. As of 31 December, 2024, the company experienced a revenue decline of approximately -14.38%. This indicates a decrease in the company's top-line earnings. As compared to competitors, the company encountered difficulties, with a growth rate lower than the average among peers in the Materials sector.
Net Margin: Ashland's net margin falls below industry averages, indicating challenges in achieving strong profitability. With a net margin of -40.74%, the company may face hurdles in effective cost management.
Return on Equity (ROE): The company's ROE is below industry benchmarks, signaling potential difficulties in efficiently using equity capital. With an ROE of -6.04%, the company may need to address challenges in generating satisfactory returns for shareholders.
Return on Assets (ROA): Ashland's ROA is below industry averages, indicating potential challenges in efficiently utilizing assets. With an ROA of -3.03%, the company may face hurdles in achieving optimal financial returns.
Debt Management: Ashland's debt-to-equity ratio is below the industry average at 0.55, reflecting a lower dependency on debt financing and a more conservative financial approach.
Analyst Ratings: Simplified
Within the domain of banking and financial systems, analysts specialize in reporting for specific stocks or defined sectors. Their work involves attending company conference calls and meetings, researching company financial statements, and communicating with insiders to publish "analyst ratings" for stocks. Analysts typically assess and rate each stock once per quarter.
Analysts may enhance their evaluations by incorporating forecasts for metrics like growth estimates, earnings, and revenue, delivering additional guidance to investors. It is vital to acknowledge that, although experts in stocks and sectors, analysts are human and express their opinions when providing insights.
Which Stocks Are Analysts Recommending Now?
Benzinga Edge gives you instant access to all major analyst upgrades, downgrades, and price targets. Sort by accuracy, upside potential, and more. Click here to stay ahead of the market.
This article was generated by Benzinga's automated content engine and reviewed by an editor.
Edge Rankings
Price Trend
© 2025 Benzinga.com. Benzinga does not provide investment advice. All rights reserved.
date | ticker | name | Price Target | Upside/Downside | Recommendation | Firm |
|---|
Trade confidently with insights and alerts from analyst ratings, free reports and breaking news that affects the stocks you care about.

