


5 analysts have shared their evaluations of Webster Financial WBS during the recent three months, expressing a mix of bullish and bearish perspectives.
The table below provides a snapshot of their recent ratings, showcasing how sentiments have evolved over the past 30 days and comparing them to the preceding months.
| Bullish | Somewhat Bullish | Indifferent | Somewhat Bearish | Bearish | |
|---|---|---|---|---|---|
| Total Ratings | 0 | 4 | 1 | 0 | 0 |
| Last 30D | 0 | 1 | 0 | 0 | 0 |
| 1M Ago | 0 | 0 | 1 | 0 | 0 |
| 2M Ago | 0 | 0 | 0 | 0 | 0 |
| 3M Ago | 0 | 3 | 0 | 0 | 0 |
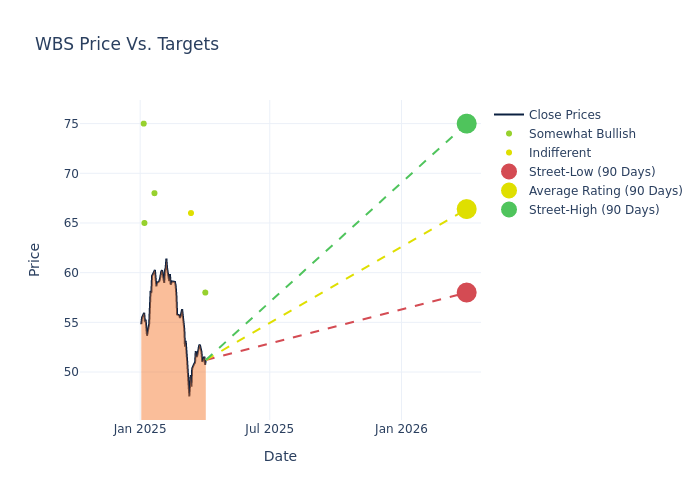
Insights from analysts' 12-month price targets are revealed, presenting an average target of $66.4, a high estimate of $75.00, and a low estimate of $58.00. Experiencing a 3.21% decline, the current average is now lower than the previous average price target of $68.60.
Understanding Analyst Ratings: A Comprehensive Breakdown
In examining recent analyst actions, we gain insights into how financial experts perceive Webster Financial. The following summary outlines key analysts, their recent evaluations, and adjustments to ratings and price targets.
| Analyst | Analyst Firm | Action Taken | Rating | Current Price Target | Prior Price Target |
|---|---|---|---|---|---|
| Daniel Tamayo | Raymond James | Lowers | Outperform | $58.00 | $65.00 |
| Manan Gosalia | Morgan Stanley | Lowers | Equal-Weight | $66.00 | $75.00 |
| Jon G. Arfstrom | RBC Capital | Raises | Outperform | $68.00 | $66.00 |
| Anthony Elian | JP Morgan | Lowers | Overweight | $65.00 | $67.00 |
| Timur Braziler | Wells Fargo | Raises | Overweight | $75.00 | $70.00 |
Key Insights:
- Action Taken: Analysts adapt their recommendations to changing market conditions and company performance. Whether they 'Maintain', 'Raise' or 'Lower' their stance, it reflects their response to recent developments related to Webster Financial. This information provides a snapshot of how analysts perceive the current state of the company.
- Rating: Providing a comprehensive analysis, analysts offer qualitative assessments, ranging from 'Outperform' to 'Underperform'. These ratings reflect expectations for the relative performance of Webster Financial compared to the broader market.
- Price Targets: Analysts predict movements in price targets, offering estimates for Webster Financial's future value. Examining the current and prior targets offers insights into analysts' evolving expectations.
Navigating through these analyst evaluations alongside other financial indicators can contribute to a holistic understanding of Webster Financial's market standing. Stay informed and make data-driven decisions with our Ratings Table.
Stay up to date on Webster Financial analyst ratings.
Get to Know Webster Financial Better
Webster Financial Corp is a full-service provider of financial services, offering commercial and consumer banking, mortgages, and investment advisory along with trust and wealth management services in Connecticut, New York, Rhode Island, Massachusetts, and Pennsylvania. The company's segment includes Commercial Banking, HSA Bank, and Consumer Banking. It generates maximum revenue from the Commercial Banking segment.
Key Indicators: Webster Financial's Financial Health
Market Capitalization: With restricted market capitalization, the company is positioned below industry averages. This reflects a smaller scale relative to peers.
Revenue Growth: Webster Financial's revenue growth over a period of 3 months has been noteworthy. As of 31 December, 2024, the company achieved a revenue growth rate of approximately 4.12%. This indicates a substantial increase in the company's top-line earnings. As compared to competitors, the company encountered difficulties, with a growth rate lower than the average among peers in the Financials sector.
Net Margin: Webster Financial's net margin falls below industry averages, indicating challenges in achieving strong profitability. With a net margin of 25.99%, the company may face hurdles in effective cost management.
Return on Equity (ROE): Webster Financial's ROE is below industry standards, pointing towards difficulties in efficiently utilizing equity capital. With an ROE of 1.93%, the company may encounter challenges in delivering satisfactory returns for shareholders.
Return on Assets (ROA): Webster Financial's ROA falls below industry averages, indicating challenges in efficiently utilizing assets. With an ROA of 0.22%, the company may face hurdles in generating optimal returns from its assets.
Debt Management: Webster Financial's debt-to-equity ratio is below industry norms, indicating a sound financial structure with a ratio of 0.34.
Analyst Ratings: What Are They?
Analysts work in banking and financial systems and typically specialize in reporting for stocks or defined sectors. Analysts may attend company conference calls and meetings, research company financial statements, and communicate with insiders to publish "analyst ratings" for stocks. Analysts typically rate each stock once per quarter.
Beyond their standard evaluations, some analysts contribute predictions for metrics like growth estimates, earnings, and revenue, furnishing investors with additional guidance. Users of analyst ratings should be mindful that this specialized advice is shaped by human perspectives and may be subject to variability.
Which Stocks Are Analysts Recommending Now?
Benzinga Edge gives you instant access to all major analyst upgrades, downgrades, and price targets. Sort by accuracy, upside potential, and more. Click here to stay ahead of the market.
This article was generated by Benzinga's automated content engine and reviewed by an editor.
Edge Rankings
Price Trend
© 2025 Benzinga.com. Benzinga does not provide investment advice. All rights reserved.
date | ticker | name | Price Target | Upside/Downside | Recommendation | Firm |
|---|
Trade confidently with insights and alerts from analyst ratings, free reports and breaking news that affects the stocks you care about.

