


Analysts' ratings for EastGroup Props EGP over the last quarter vary from bullish to bearish, as provided by 5 analysts.
Summarizing their recent assessments, the table below illustrates the evolving sentiments in the past 30 days and compares them to the preceding months.
| Bullish | Somewhat Bullish | Indifferent | Somewhat Bearish | Bearish | |
|---|---|---|---|---|---|
| Total Ratings | 1 | 1 | 3 | 0 | 0 |
| Last 30D | 0 | 0 | 1 | 0 | 0 |
| 1M Ago | 0 | 0 | 1 | 0 | 0 |
| 2M Ago | 0 | 1 | 1 | 0 | 0 |
| 3M Ago | 1 | 0 | 0 | 0 | 0 |
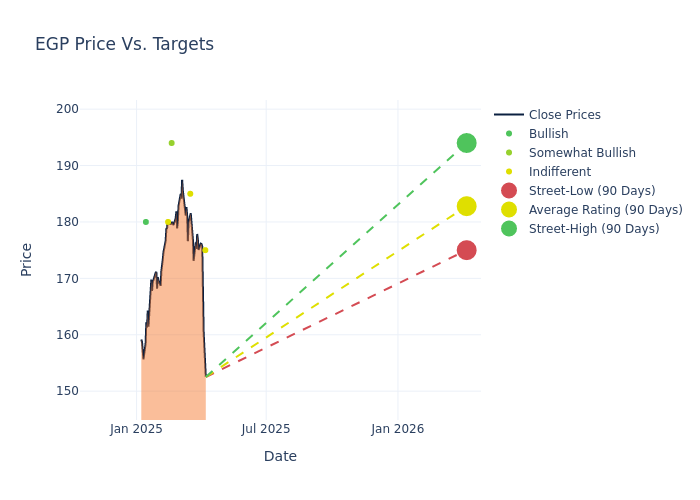
Analysts have recently evaluated EastGroup Props and provided 12-month price targets. The average target is $182.8, accompanied by a high estimate of $194.00 and a low estimate of $175.00. Highlighting a 3.66% decrease, the current average has fallen from the previous average price target of $189.75.
Analyzing Analyst Ratings: A Detailed Breakdown
The standing of EastGroup Props among financial experts is revealed through an in-depth exploration of recent analyst actions. The summary below outlines key analysts, their recent evaluations, and adjustments to ratings and price targets.
| Analyst | Analyst Firm | Action Taken | Rating |Current Price Target| Prior Price Target | |--------------------|--------------------|---------------|---------------|--------------------|--------------------| |Alexander Goldfarb |Piper Sandler |Lowers |Neutral | $175.00|$218.00 | |Steve Sakwa |Evercore ISI Group |Raises |In-Line | $185.00|$181.00 | |David Rodgers |Baird |Raises |Outperform | $194.00|$192.00 | |Ki Bin Kim |Truist Securities |Raises |Hold | $180.00|$168.00 | |Omotayo Okusanya |Deutsche Bank |Announces |Buy | $180.00|- |
Key Insights:
- Action Taken: Analysts frequently update their recommendations based on evolving market conditions and company performance. Whether they 'Maintain', 'Raise' or 'Lower' their stance, it reflects their reaction to recent developments related to EastGroup Props. This information provides a snapshot of how analysts perceive the current state of the company.
- Rating: Providing a comprehensive analysis, analysts offer qualitative assessments, ranging from 'Outperform' to 'Underperform'. These ratings reflect expectations for the relative performance of EastGroup Props compared to the broader market.
- Price Targets: Analysts navigate through adjustments in price targets, providing estimates for EastGroup Props's future value. Comparing current and prior targets offers insights into analysts' evolving expectations.
Assessing these analyst evaluations alongside crucial financial indicators can provide a comprehensive overview of EastGroup Props's market position. Stay informed and make well-judged decisions with the assistance of our Ratings Table.
Stay up to date on EastGroup Props analyst ratings.
Discovering EastGroup Props: A Closer Look
EastGroup Properties Inc is an equity real estate investment trust. It is engaged in the development, acquisition, and operation of industrial properties in Sunbelt markets throughout the United States, predominantly in the states of Florida, Texas, Arizona, California, and North Carolina. The company manages a portfolio of industrial properties. The vast majority of these properties are multi-tenant business distribution buildings that provide large warehousing and office space for customers. The group has one reportable segment, which is industrial properties. The company derives its revenue in the form of rental income.
Understanding the Numbers: EastGroup Props's Finances
Market Capitalization: Indicating a reduced size compared to industry averages, the company's market capitalization poses unique challenges.
Revenue Growth: EastGroup Props's remarkable performance in 3M is evident. As of 31 December, 2024, the company achieved an impressive revenue growth rate of 9.99%. This signifies a substantial increase in the company's top-line earnings. As compared to competitors, the company surpassed expectations with a growth rate higher than the average among peers in the Real Estate sector.
Net Margin: EastGroup Props's net margin is below industry standards, pointing towards difficulties in achieving strong profitability. With a net margin of 35.75%, the company may encounter challenges in effective cost control.
Return on Equity (ROE): EastGroup Props's ROE lags behind industry averages, suggesting challenges in maximizing returns on equity capital. With an ROE of 1.91%, the company may face hurdles in achieving optimal financial performance.
Return on Assets (ROA): EastGroup Props's ROA is below industry averages, indicating potential challenges in efficiently utilizing assets. With an ROA of 1.19%, the company may face hurdles in achieving optimal financial returns.
Debt Management: EastGroup Props's debt-to-equity ratio is below the industry average. With a ratio of 0.47, the company relies less on debt financing, maintaining a healthier balance between debt and equity, which can be viewed positively by investors.
The Significance of Analyst Ratings Explained
Analysts are specialists within banking and financial systems that typically report for specific stocks or within defined sectors. These people research company financial statements, sit in conference calls and meetings, and speak with relevant insiders to determine what are known as analyst ratings for stocks. Typically, analysts will rate each stock once a quarter.
Some analysts will also offer forecasts for metrics like growth estimates, earnings, and revenue to provide further guidance on stocks. Investors who use analyst ratings should note that this specialized advice comes from humans and may be subject to error.
Breaking: Wall Street's Next Big Mover
Benzinga's #1 analyst just identified a stock poised for explosive growth. This under-the-radar company could surge 200%+ as major market shifts unfold. Click here for urgent details.
This article was generated by Benzinga's automated content engine and reviewed by an editor.
Edge Rankings
Price Trend
© 2025 Benzinga.com. Benzinga does not provide investment advice. All rights reserved.
date | ticker | name | Price Target | Upside/Downside | Recommendation | Firm |
|---|
Trade confidently with insights and alerts from analyst ratings, free reports and breaking news that affects the stocks you care about.

