Tiffany & Co. TIF shares have been on a rebound after suffering a nasty gap down in price in early 2015.
Now, with the stock sitting between multiple layers of support and resistance, the question is whether the company's fundamentals can power the shares higher. Much of that depends on the continued free-spending ways of the wealthy consumer globally.
Word has been getting around the Street that the uber-wealthy have been reigning in spending in anticipation of some economic upset.
However, even if that's true temporarily, how long can that segment of the population remain sitting on their cash before human nature gets the best of them?
Below is a look at the fundamentals and technicals of Tiffany & Co. to get a better picture of what lies ahead for shareholders:
What the bulls see in Tiffany
Some cheap valuation metrics:
- An enterprise value of $12.26 billion that trumps the market capitalization of $11.86 billion
- A price-to-sales ratio of 2.83
- 11.04% net profit margins that spin off over $546 million in positive levered free cash flow annually
Impressive management effectiveness ratios:
- A return-on-assets of 10.67%
- A return-on-equity of 16.13%
Some strong balance sheet metrics:
- A current ratio of 6.12
- A debt-to-equity ratio of only 37.39%
- An add-on in the form of the company's 1.7% dividend yield
What the bears see in Tiffany
Some expensive valuation metrics:
- A price-to-book ratio of 4.14
- A PE of 19 versus estimated revenue and EPS growth for next year of 15.7% and 12.5%, respectively
- Only $715.4 million in cash reserves versus over $1 billion in debt
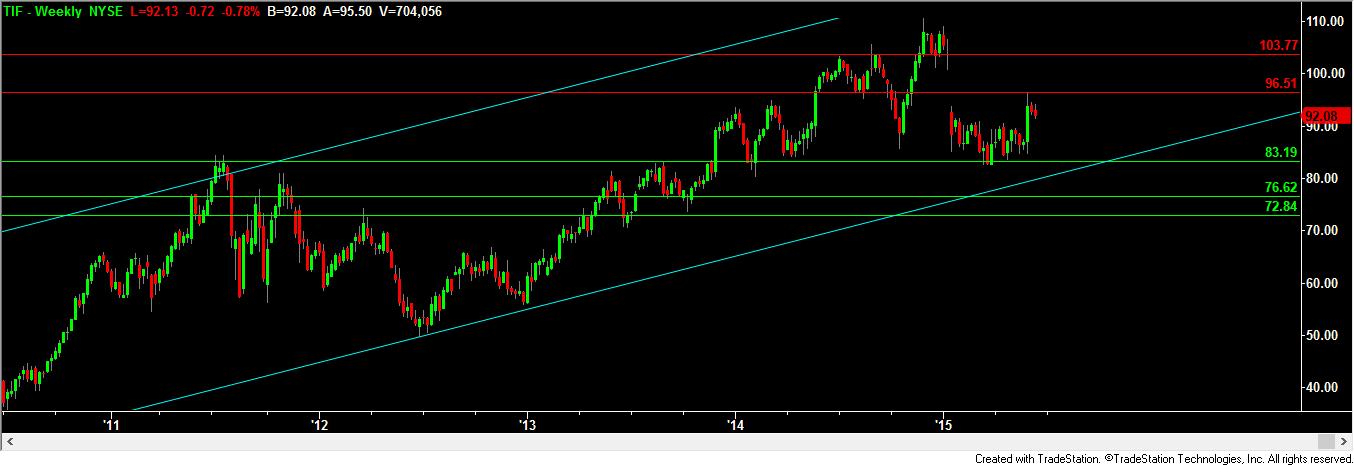
The technical take on Tiffany shares
Technicians note that Tiffany shares have been on a nice rebound recently after having a tough first several months of 2015. Last week saw some declines – which should be welcomed by longer-term shareholders who want "healthy" gains instead of unsustainable ones.
The drop, however, leaves the stock in the middle of support and resistance – offering no edge to either the bulls or the bears right now. Support for the stock comes in at $89.18 and then $83.19.
Either of those are logical spots for the bulls to be initiating new positions or adding to existing longs. Resistance for the stock comes in at the May peak of $96.51 and is backed up by horizontal line resistance (representing the upper edge of the recent downside gap) at $103.77.
Overall
Tiffany shares could be a very attractive long candidate if and when the stock trades closer to identifiable support. The company is plugged into the right segment of the global economy – the wealthy consumer.
While lower-end consumers continue to struggle, the wealthy of the world are sitting pretty with inflated stock prices and central bankers who seem content with keeping rates low for the time being.
These trends, along with potentially attractive technicals, will make Tiffany shares very interesting to watch as the stock nears support.
© 2024 Benzinga.com. Benzinga does not provide investment advice. All rights reserved.
Comments
Trade confidently with insights and alerts from analyst ratings, free reports and breaking news that affects the stocks you care about.

