Zinger Key Points
- The sell in May and go away strategy is rooted in historical stock market patterns.
- "Unless investors can seek superior returns in other asset classes, being out of the equity market may not have been the best strategy."
- Pelosi’s latest AI pick skyrocketed 169% in just one month. Click here to discover the next stock our government trade tracker is spotlighting—before it takes off.
As we enter May, the old Wall Street adage “sell in May and go away” is finding its way back into the conversations of traders and investors.
The strategy suggests the stock market tends to underperform from May through October compared to the November through April period.
A deeper dive into historical data and market trends suggests the trade may not always be the wisest course of action.
Sell In May And Go Away: Historical Performance
The sell in May and go away strategy is rooted in historical stock market patterns.
George Smith, a portfolio strategist at LPL Financials, highlights that since 1950, the May-October period has been the weakest six-month cycle in the stock market. In contrast, the November-April period sees far stronger stock returns.
“Unless investors can seek superior returns in other asset classes, being out of the equity market may not have been the best strategy,” Smith says.
The expert remarks that average returns for the S&P 500 index during the May-October months have remained positive, recording 1.8% gains since 1950 and approximately 4.4% over the last five and 10 years.
The S&P 500 Index has recorded a cumulative six-month average gain of 6.7% in the period between November to April, the Corporate Finance Institute (CFI) finds.
Andrew Loo, vice president of Capital Markets at CFI, highlights that the May to October interval generally sees subdued market optimism. This downturn follows the conclusion of first-quarter results and coincides with a seasonal decline in market attention as individuals take summer vacations.
Additionally, Loo says that during election years, the stock market often experiences a slump in September and October, primarily due to the uncertainties surrounding election outcomes.
Sell In May And Go Away In Elections Years: Myth Debunked
Contrary to popular belief, presidential election years do not necessarily equate to increased market volatility.
Rocky White, senior quantitative analyst at Schaeffer’s Research, says the six-month returns leading to November presidential election have been rather positive.
During presidential election years, the average return for the S&P 500 index is notably higher at 4.67%, compared to only 0.95% in midterm election years and 2.14% in non-election years.
Presidential election years have the highest rate of positive returns at 89%, significantly higher than the 63% seen in both midterm and non-election years.
This suggests that the May-October window in a presidential election year tends to be more favorable for the stock market.
S&P 500 Returns From Early May To Early November
| Category | Presidential Election* | Mid-Term Election | Non-Election Years |
|---|---|---|---|
| No. of Returns | 19 | 19 | 38 |
| Average Return | 4.67% | 0.95% | 2.14% |
| Median Return | 4.29% | 2.38% | 2.22% |
| Percent Positive | 89% | 63% | 63% |
| Avg. Positive | 6.91% | 7.11% | 6.92% |
| Avg. Negative | -14.33% | -9.62% | -6.06% |
| Std. Deviation | 9.77% | 9.92% | 7.92% |
6-Month S&P 500 Returns Are Even Better With Incumbent President In The Race
White also notes that during presidential election years with an incumbent candidate, the S&P 500 has performed exceptionally well in the six months leading up to the ballots.
Since 1948, the index has averaged returns of 7.57%, with 91% of returns being positive. In stark contrast, years without an incumbent have barely broken even, with the 2008 financial crisis heavily skewing the averages.
S&P 500 Returns In 6 Months Leading Up To US Presidential Election
| Category | Incumbent Running | No Incumbent |
|---|---|---|
| No. of Returns | 11 | 8 |
| Average Return | 7.57% | 0.69% |
| Median Return | 6.43% | 3.58% |
| Percent Positive | 91% | 88% |
| Avg. Positive | 8.42% | 4.76% |
| Avg. Negative | -0.87% | -27.78% |
| Std. Deviation | 7.05% | 11.95% |
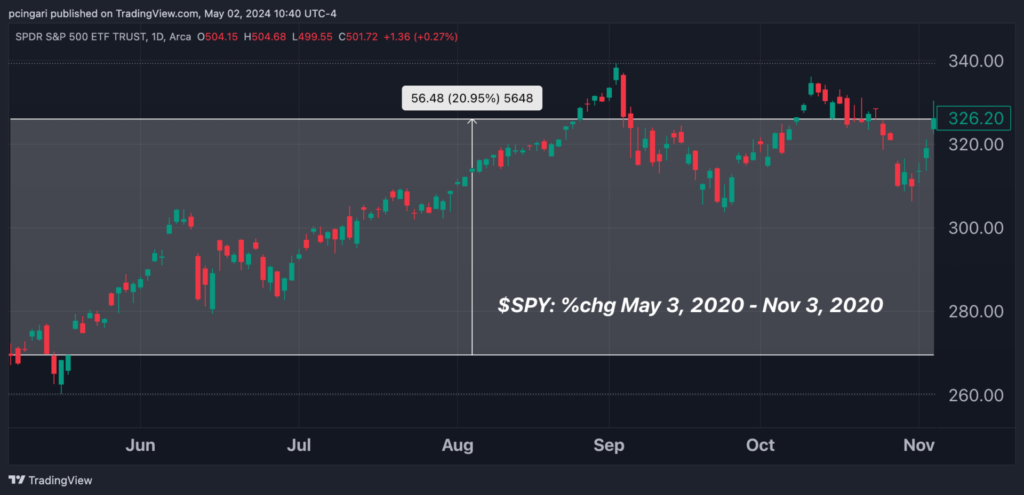
In the last U.S. presidential election, the S&P 500 index, as tracked by the SPDR S&P 500 ETF Trust SPY, rallied by over 20% in the six months leading up to the Nov. 3, 2020 vote. In that case, the incumbent running was Donald Trump.

Benzinga’s Take: Several studies suggests the decision to “sell in May and go away” may be overly simplistic and potentially disadvantageous for investors.
With historical data showing positive average returns even during the traditionally weaker months, and election years not necessarily exacerbating market volatility, a blanket strategy of exiting the stock market right away may not be prudent.
Illustration created using Shutterstock photos and artificial intelligence via MidJourney.
Edge Rankings
Price Trend
© 2025 Benzinga.com. Benzinga does not provide investment advice. All rights reserved.
Trade confidently with insights and alerts from analyst ratings, free reports and breaking news that affects the stocks you care about.