Zinger Key Points
- Bond market volatility hits 1-year high as Americans vote in a historically close presidential race.
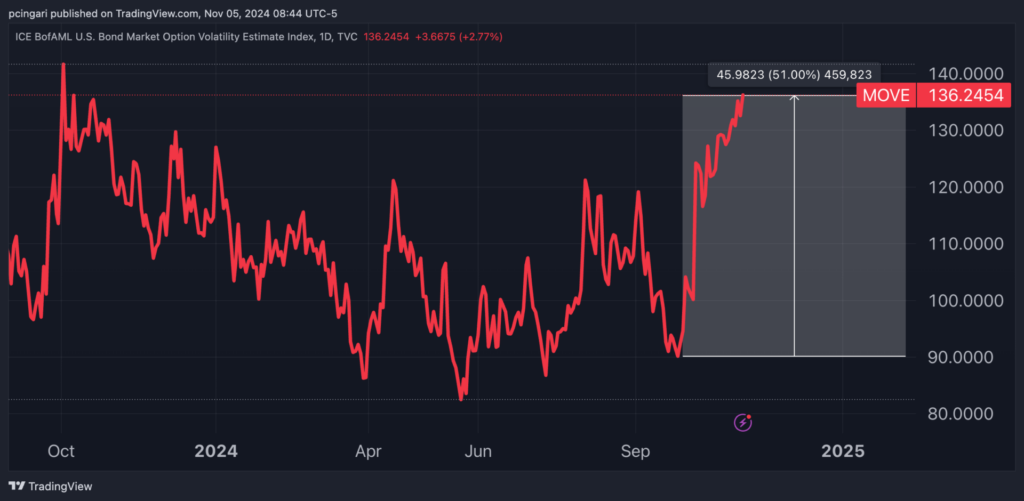
- The MOVE index, a "fear gauge" for bonds, jumped 51% since late September, signaling investor anxiety.
- Get real-time earnings alerts before the market moves and access expert analysis that uncovers hidden opportunities in the post-earnings chaos.
A widely watched gauge of bond market volatility has surged to its highest level in over a year as American voters cast their ballots in one of the closest presidential races in recent history.
The ICE BofAML U.S. Bond Market Option Volatility Estimate Index, or “MOVE” index, closed at 136 on Monday, reaching levels last seen in early October 2023.
This spike in the MOVE index highlights mounting anxiety in the bond market, driven by political uncertainty and fears of inflationary fiscal policies.
What Is The MOVE Index?
The MOVE index, often described as the VIX for bonds, measures expected volatility in the Treasury market based on options pricing.
Like the VIX, which tracks volatility in the equity market, the MOVE index is seen as a “fear gauge” for fixed-income investors.
Higher MOVE readings indicate increased uncertainty about future bond price movements, reflecting traders’ fears around interest rates, inflation, and broader economic conditions.
See Also: Beginners Guide to VIX or Volatility Indices
Election Jitters Fuel Bond Market Anxiety
The U.S. presidential election has investors on edge, with polls showing one of the tightest races in modern American history.
Neither Vice President Kamala Harris nor ex-President Donald Trump held a meaningful lead in critical battleground states ahead of Nov. 5, wrote Nate Cohn, chief political analyst at the New York Times.
“In the history of modern polling, there's never been a campaign where the final polls showed such a close contest,” he added.
The possibility of a prolonged, contentious result has amplified concerns in the bond market, where volatility has jumped 51% since late September.
Fixed-income investors are also weighing the potential fiscal impact of each candidate’s policies, especially if the winner's administration fuels inflation and adds to the federal debt.
According to the Committee for a Responsible Federal Budget (CRFB), Trump's spending plans could increase the national debt by $7.75 trillion over the next decade, driving the debt-to-GDP ratio to 143% by 2035. By contrast, Kamala Harris's proposals would add $3.95 trillion to the debt, resulting in a debt-to-GDP ratio of approximately 134% by the same year.
Chart: Bond Volatility Index Has Risen By Over 50% Since Late-September

Trump's Tariff Plans Stoke Inflation Fears
Under a Trump administration, inflation could rise if proposed tariffs on Chinese imports and other goods come into effect.
Trump has floated a 60% tariff on Chinese products and a universal 10% tariff, policies which JPMorgan analysts estimate could drive inflation up by as much as 2.4% in a worst-case scenario.
“Tariffs are inflationary,” IMF deputy managing director Gita Gopinath warned in October.
With inflation a growing concern, Treasury yields have been on an upward trajectory, as investors demand higher returns to offset potential future price increases.
Yields on the 10-year Treasury bond have risen by 50 basis points last month and hit 4.33% on Tuesday.
‘Bond Vigilantes’ Are Back
The bond market’s reaction to these uncertainties has been swift and severe.
“Nothing seems to be stopping U.S. Treasury bond yields from rising,” said veteran Wall Street investor Ed Yardeni.
“The Bond Vigilantes have been voting early (and voting often) by selling US Treasury notes and bonds,” he added.
The iShares 20+ Year Treasury Bond ETF TLT, which tracks long-dated Treasuries, fell nearly 6% in October 2024.
With both candidates likely to enact substantial stimulus, Yardeni stated, “The bond market is tightening the economy itself,” as investors anticipate inflation and higher interest rates.
Yardeni indicated this surge in yields could push the 10-year Treasury into the 5% range, a level not seen since before the financial crisis.
Now Read:
Image: Shutterstock
© 2025 Benzinga.com. Benzinga does not provide investment advice. All rights reserved.
Trade confidently with insights and alerts from analyst ratings, free reports and breaking news that affects the stocks you care about.