The Materials sector ranks fifth out of the ten sectors as detailed in my sector roadmap. It gets my Neutral rating, which is based on aggregation of ratings of 11 ETFs and 11 mutual funds in the Materials sector as of July 12, 2012. Reports on the best & worst ETFs and mutual funds in every sector and style are here.
Figure 1 shows the five best and worst-rated Materials ETFs and Figure 2 ranks from best to worst the nine Materials mutual funds that meet our liquidity standards. Not all Materials sector ETFs and mutual funds are created the same. The number of holdings varies widely (from 30 to 156), which creates drastically different investment implications and ratings. The best ETFs and mutual funds allocate more value to Attractive-or-better-rated stocks than the worst ETFs and mutual funds, which allocate too much value to Neutral-or-worse-rated stocks.
To identify the best and avoid the worst ETFs and mutual funds within the Materials sector, investors need a predictive rating based on (1) stocks ratings of the holdings and (2) the all-in expenses of each ETF and mutual fund. Investors need not rely on backward-looking ratings. My fund rating methodology is detailed here.
Investors should not buy any Materials ETFs or mutual funds because none get an Attractive-or-better rating. If you must have exposure to this sector, you should buy a basket of Attractive-or-better rated stocks and avoid paying undeserved fund fees. Active management has a long history of not paying off.
See ratings and reports on all ETFs and mutual funds in this sector on my free mutual fund and ETF screener.
Figure 1: ETFs with the Best & Worst Ratings – Top 5
* Best ETFs exclude ETFs with TNA’s less than 100 million for inadequate liquidity.
Sources: New Constructs, LLC and company filings
PowerShares Dynamic Basic Materials PYZ is excluded from Figure 1 because its total net assets (TNA) are below $100 million and do not meet our liquidity standards.
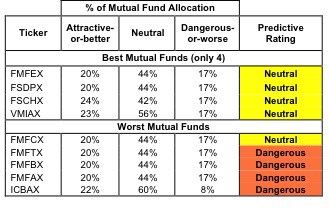
Figure 2: Mutual Funds with the Best & Worst Ratings – Top 5 (where available)
* Best mutual funds exclude funds with TNA’s less than 100 million for inadequate liquidity.
Sources: New Constructs, LLC and company filings
ICON Funds: ICON Materials Fund ICBMX and ICON Funds: ICON Materials Fund ICBCX are excluded from Figure 2 because their total net assets (TNA) are below $100 million and do not meet our liquidity standards.
iShares S&P North American Natural Resources Sector Index Fund IGE is my top-rated Materials ETF and Fidelity Select Portfolios: Fidelity Advisor Materials Fund FMFEX is my top-rated Materials mutual fund. Both earn my Neutral rating.
SPDR S&P Metals & Mining ETF XME is my worst-rated Materials ETF and ICON Funds: ICON Materials Fund ICBAX is my worst-rated Materials mutual fund. Both earn my Dangerous rating.
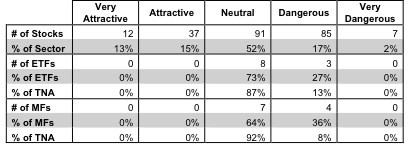
Figure 3 shows that 49 out of the 232 stocks (over 28% of the total net assets) held by Materials ETFs and mutual funds get an Attractive-or-better rating. However, there are not any Materials ETFs or Materials mutual funds that get an Attractive-or-better rating.
The takeaway is: Materials ETFs and mutual funds are not picking the right stocks and are undeserving of their fees no matter how small.
Figure 3: Materials Sector Landscape For ETFs, Mutual Funds & Stocks
As detailed in “Cheap Funds Dupe Investors”, the fund industry offers many cheap funds but very few funds with high-quality stocks, or with what I call good portfolio management.
I do not recommend that investors buy any Materials ETFs or mutual funds. Instead, I would recommend buying a basket of individual Attractive-or-better rated Materials stocks.
Freeport-McMoRan Copper & Gold, Inc. FCX is one of my favorite stocks held by Materials ETFs and mutual funds and earns my Very Attractive rating. Freeport-McMoRan is one of the largest copper, gold, and molybdenum mining companies in the world. Although investors often assume that mining companies trade according to the price movements of the commodities they produce, not all Materials companies generate the same profits per ounce of gold or pound of copper. In that regard, FCX is one of the best. FCX’s ROIC is 16.2%, meaning that it generates higher returns on invested capital than 86% of other Materials companies. Despite fluctuations in commodity prices, FCX earned a ROIC that beat its WACC in each of the last 7 years, generating the economic profits that drive shareholder value. Furthermore, the market is pricing Freeport-McMoRan as if its operating profitability will permanently decline by 48%. This pessimistic valuation makes a highly profitable company like FCX a Very Attractive stock right now.
Weyerhaeuser WY is one of my least favorite stocks held by Materials ETFs and mutual funds and earns my Dangerous rating. Weyerhaeuser has not earned a ROIC that beat its WACC a single time in the 14 years I have covered the company. In fact, WY’s ROIC at 2.1% places it in the bottom 15% of Materials companies. Despite Weyerhaeuser’s consistent record of paltry returns and ineffective capital allocation, the market’s valuation implies high expectations for future growth and profitability. In order to justify its current stock price, Weyerhaeuser needs compounded annual revenue growth of over 15% for the next 20 years, a daunting task for a Materials company. When you combine a sky-high valuation, consistently unimpressive returns, and Weyerhaeuser’s nearly $4.5 billion in debt and $1.5 billion in underfunded pensions, you get a high-risk/low-reward stock.
168 stocks of the 3000+ I cover are classified as Materials stocks, but due to style drift, Materials ETFs and mutual funds hold 232 stocks.
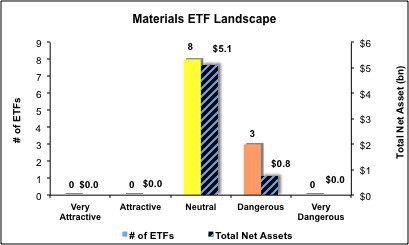
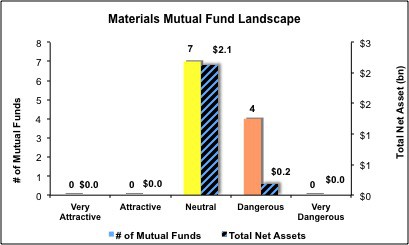
Figures 4 and 5 show the rating landscape of all Materials ETFs and mutual funds.
Our sector roadmap report ranks all sectors and highlights those that offer the best investments.
Figure 4: Separating the Best ETFs From the Worst ETFs
Figure 5: Separating the Best Mutual Funds From the Worst Mutual Funds
Review my full list of ratings and rankings along with free reports on all 11 ETFs and 11 mutual funds in the Materials sector.
Disclosure: I receive no compensation to write about any specific stock, sector or theme.
Edge Rankings
Price Trend
© 2025 Benzinga.com. Benzinga does not provide investment advice. All rights reserved.
Trade confidently with insights and alerts from analyst ratings, free reports and breaking news that affects the stocks you care about.


