


Some traders love trading ranges. And the SPDR S&P 500 ETF Trust SPY may be forming one.
A stock is in a trading range when there is clear resistance at the top of the range and clears support at the bottom. Traders profit by selling close to the top and buying close to the bottom.
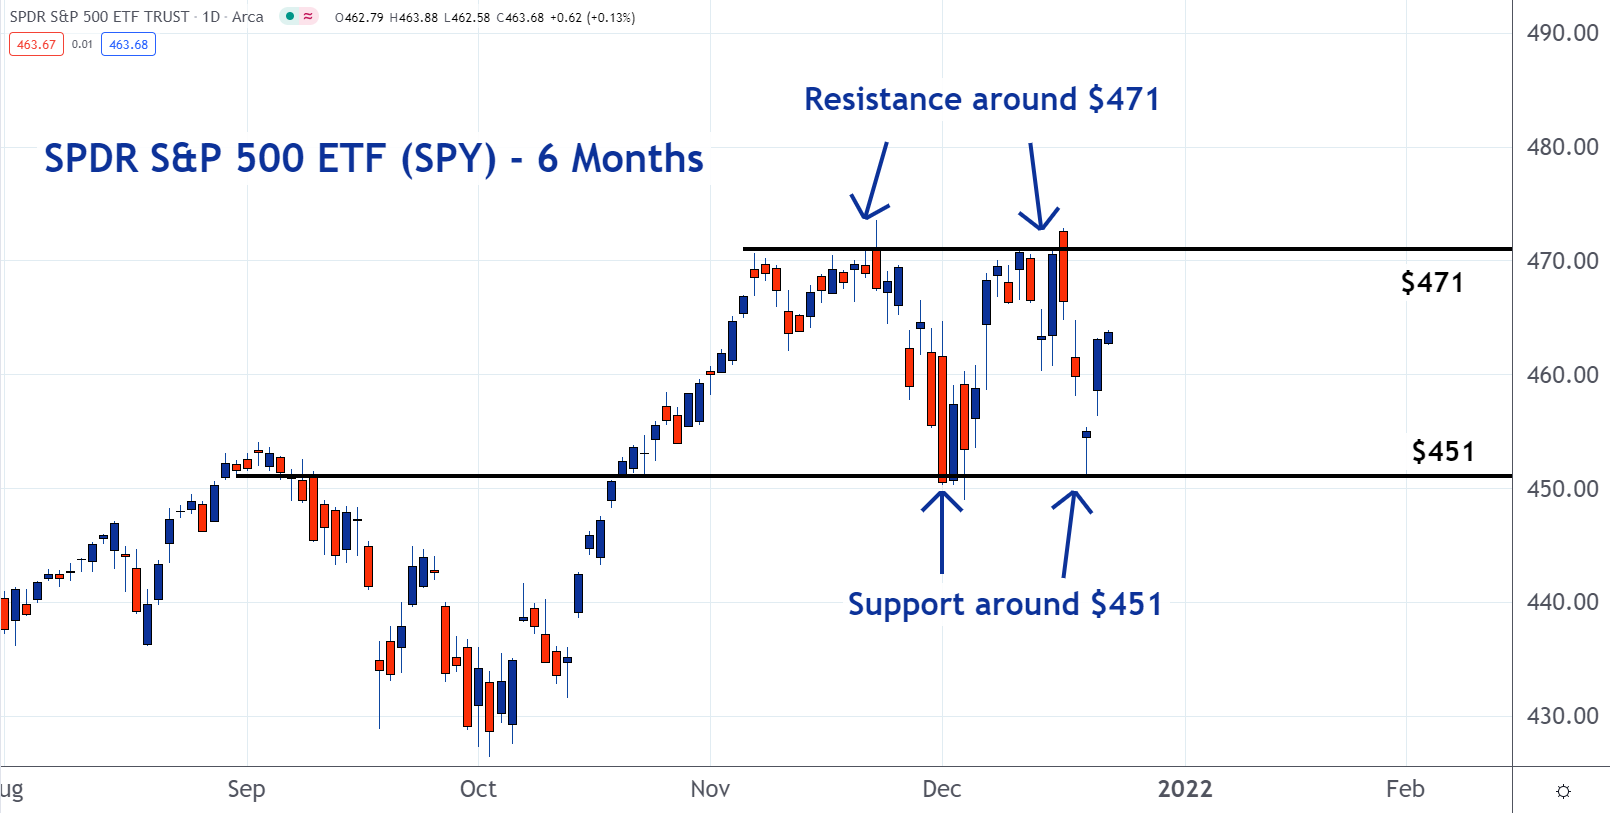
Resistance is a large group of sellers offering shares at or close to the same price. In the case of SPY it’s $471. At resistance levels, there is more than enough supply to fill all the demand, so rallies end or pause when they reach those areas.
Support is a large group of buyers looking to pay the same price for shares. At support levels, there is enough demand to absorb all the supply. Stocks stop going lower when they reach these levels. For SPY there is support around $451.
As long as this range is intact, traders will be looking to profit by buying around $451 and selling around $471.
See Also: The SPY Stages A Rebound: Is This Finally The Beginning Of The Santa Claus Rally?
Edge Rankings
Price Trend
© 2025 Benzinga.com. Benzinga does not provide investment advice. All rights reserved.
Trade confidently with insights and alerts from analyst ratings, free reports and breaking news that affects the stocks you care about.

