


The S&P 500 and Nasdaq 100 indices fell sharply on Thursday after President Donald Trump announced sweeping tariffs on U.S. trading partners, following the market close on Wednesday. The indices have logged double-digit declines since Trump’s inauguration on Jan. 20, and technical charts indicate bearish momentum.
What Happened: The S&P 500 index slumped 4.84% to 5,396.52 points on Thursday, declining by 10.79% since Trump’s inauguration day, when the index jumped with joy as the Republican president began his term on Jan. 20.
Nasdaq 100, on the other hand, spiraled 5.41% to 18,521.48 points, down by 14.12% since Trump’s inauguration.
However, during former President Barack Obama‘s tenure, the S&P 500 rose 4.10% and the Nasdaq 100 gained 1.78% between his inauguration on Jan. 20, 2013, and April 3, 2013.
Similarly, the S&P 500 rose 5.87% and the Nasdaq 100 advanced 2.27% from Jan. 20, 2021, to April 3, 2021, during ex President Joe Biden‘s tenure.
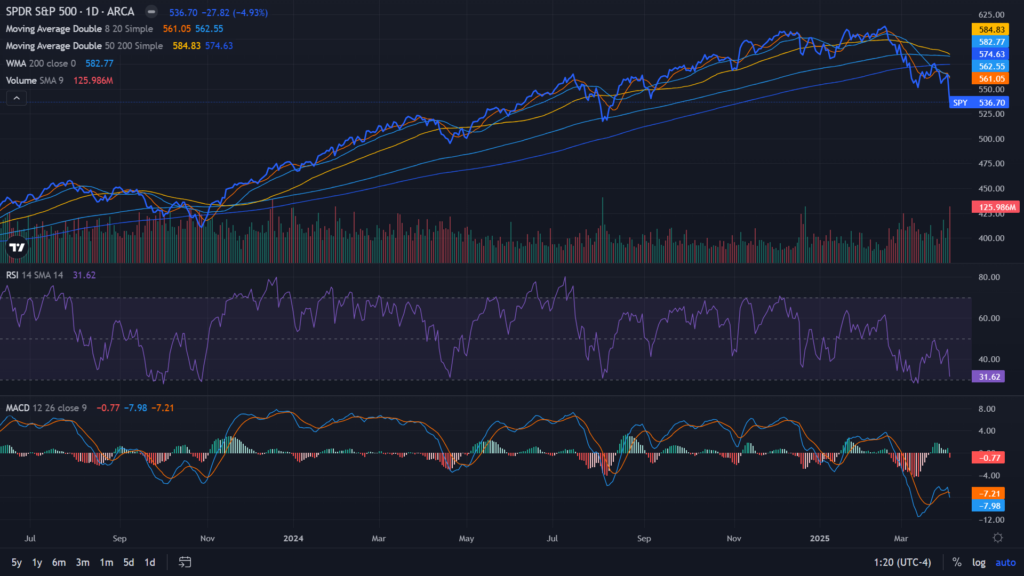
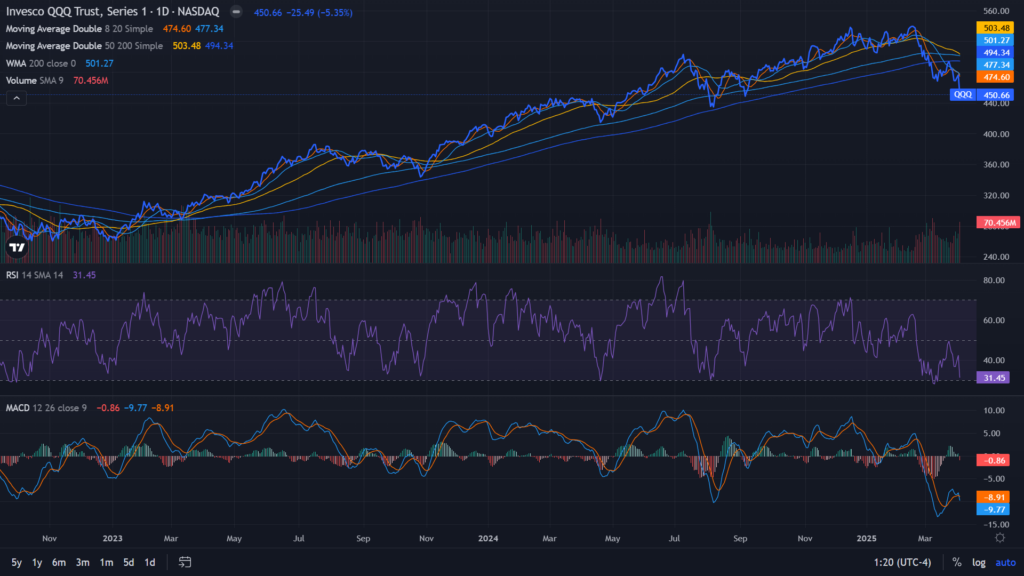
Technical analysis of the exchange-traded funds tracking these indices, namely SPDR S&P 500 ETF Trust SPY and Invesco QQQ Trust, Series 1 QQQ, indicated a bearish trend and weakening momentum according to Benzinga Pro data.
SPY
As of Thursday’s close, SPY was at $536.70, which was below its short and long-term averages. While that clearly signaled a bearish trend, the relative strength index at 31.62 was close to the oversold territory.
The momentum indicator, MACD, also pointed toward a weaker trend. SPY’s MACD line was at -7.98, showing that its 12-period exponential moving average is below the 26-period EMA.
Additionally, the histogram was negative at -0.77, meaning that the MACD line was falling further below the signal line. This depicts that the bearish momentum is increasing.
QQQ
QQQ closed at $450.66 on Thursday, and it was also below its short and long-term simple moving averages. The RSI at 31.45 was closer to the oversold zone, whereas its MACD line was much below the signal line with a negative -9.77 metric.
These factors indicated a strong bearish trend for QQQ as well.
Price Action: Apart from its move from the inauguration day on Jan. 20, both indices were also in the correction zone as they plunged below 10% from their previous highs.
The S&P 500 index was down 12.22% from its record high of 6,147.43 points, scaled on Feb. 19. Whereas, the Nasdaq 100 was 16.65% lower from its 52-week high of 22,222.61 points, essentially getting closer to the bear market territory of -20%.
On Friday, the futures of the Dow Jones index dropped 0.31%, whereas the S&P 500 and Nasdaq 100 indices also declined by 0.27% and 0.26%, respectively.
Read Next:
Photo courtesy: Shutterstock
Edge Rankings
Price Trend
© 2025 Benzinga.com. Benzinga does not provide investment advice. All rights reserved.
Trade confidently with insights and alerts from analyst ratings, free reports and breaking news that affects the stocks you care about.

