


(Monday Market Open) Oil prices fell overnight as new China’s economic reports raised concerns of an economic slowdown and possible reduction in global demand for oil.
Potential Market Movers
WTI crude oil futures were down 5% in the premarket in response to The People’s Bank of China’s (PBOC) surprise rate cut to stimulate economic growth after new economic data showing weak retail sales and industrial production. The China Beige Book revealed a slowdown in major sectors with falling credit supply and credit demand. Additionally, China’s home prices also fell in June. Despite that, the central bank’s cut was pretty small—just 10 basis points—but it comes on top of PBOC’s other recent actions to slow credit.
Falling oil futures had several energy stocks trading lower ahead of the opening bell. Chevron (CVX) fell 2.70%, ConocoPhillips (COP) tumbled 3.62%, Exxon Mobil XOM dropped 2.88%, Devon Energy DVN slid 3.75%, and Occidental Petroleum OXY was down 2.18%.
Chinese electric vehicle maker Li Auto LI reported a smaller-than-expected loss amid revenues that came in well below expectations. LI fell 4.71% in premarket action and pulled fellow Chinese EV makers NIO NIO and XPeng (XPeng) lower at 2.37% and 3.97% respectively. On the bright side of the EV market, Tesla TSLA CEO Elon Musk tweeted that TSLA’s Giga Shanghai factory rolled out its millionth car. Tesla has made over three million cars.
Despite the bad economic news coming out of China, the Shanghai composite was down just 0.02% and Hong Kong’s Hang Seng traded 0.67% lower.
With the PBOC cutting interest rates and the Federal Reserve, European Central Bank, and the Bank of England leading several other smaller central banks in raising rates, there’s now a global divergence in central bank policies. However, this is likely due to China’s zero-COVID policy resulting in lockdowns that have restricted Chinese workers and consumers from their normal activities.
S&P 500 futures were down 0.48% and Nasdaq futures were down 0.28% largely in reaction to the news from China.
Additionally, the Inflation Reduction Act passed the U.S. House of Representatives over the weekend and is expected to be signed into law by President Biden later this week. Also, investors will likely be watching new housing market data and the retail sales report closely.
Reviewing the Market Minutes
The S&P 500® index (SPX) closed the week on a positive note, climbing 1.73% on Friday and rallying right into the close. The Dow Jones Industrial Average ($DJI) rose 1.27%. The Nasdaq ($COMP) outperformed the major indexes, rallying 2.09%. The rally was relatively broad with NYSE advancers outpacing decliners nearly 3-to-1.
The energy sector was one of the weakest as WTI crude oil futures fell 2.1% to settle at $92.34 per barrel. Natural gas futures continued their volatility, falling 1.3% after gaining more than 9% Thursday.
Investors were looking to take on more risk this week, judging by the Russell 2000 (RUT) small-cap index that rose 3.6% and the S&P 400 Mid-Cap Index that climbed nearly 3% for the week. Compare that performance to the S&P 500 rising nearly 2.3% and the CRSP U.S. Mega-Cap Index that finished the week a little higher than 2%.
So far, August has been good to smaller companies. As we near the halfway point, the Russell 2000 has been leading the market, rising more than 8% in the first two weeks of August and now nearly 5%. The S&P 500 and mega-cap indexes are above 4% each.
Interest in smaller companies is a sign of bullishness for the market not just because investors are comfortable taking on more risk. It also increases the overall market breadth. The NYSE advance/decline line has risen for nearly a month and is back to its March highs.
Despite taking on more risk in equities, investors are also buying Treasuries. They appear to be favoring the 10-year Treasury, which is driving prices higher and pushed its yield down four basis points to 2.85% on Friday. The 2-year Treasury yield was up five basis points, finishing at 3.25%. The difference between the yields deepened the 2s10s ratio inversion for the day. However, both yields closed the week near where they started.
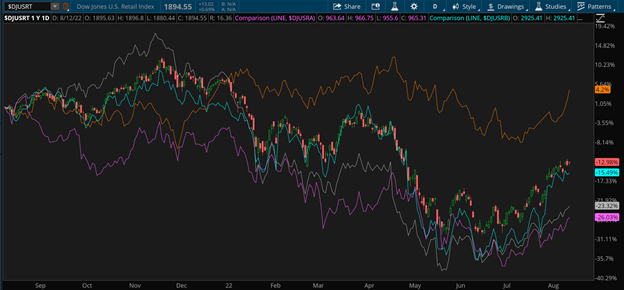
CHART OF THE DAY: WHAT’S IN STORE. The Dow Jones U.S. Retail Index ($DJUSRT—candlesticks) has recently rebounded with the overall market but is still down about 13% over the previous 12 months. The Dow Jones U.S. Drug Retailers ($DJUSRD—orange) has been the top-performing subgroup in the retail space and is up more than 4% over the last year. The Dow Jones U.S. Broadline Retailers ($DJDUSRB—blue) has recently surged, breaking away from the Dow Jones U.S. Specialty Retailers ($DJUSRS—gray) and the Dow Jones U.S. Apparel Retailers ($DJUSRA—pink), which may be a good sign for the group. Data Sources: ICE, S&P Dow Jones Indices. Chart source: The thinkorswim® platform. For illustrative purposes only. Past performance does not guarantee future results.
Three Things to Watch
TAKING INVENTORY: While numerous retailers have already reported Q2 earnings, the industry group will take center stage this week with the likes of Walmart WMT, Home Depot HD, Lowe’s LOW, and Target TGT set to report. The U.S. retail sales report is also due on Wednesday.
We’ve already seen earnings warnings from some retailers like Walmart citing fewer sales and high inventories. The U.S. Retail Inventories excluding autos report was released on July 27, and it confirmed that inventories are high because they increased 1.6% in the month of June. May inventories that were originally reported as an increase of 0.8% were revised higher to 1.4%.
Investors will likely focus on statements around how well retailers have been able to unload inventories, how back-to-school shopping is going, and plans for the not-too-distant holiday shopping season.
DRUGSTORE COWBOY: The Dow Jones U.S. Drug Retailers index has performed well throughout the bear market because prescription drugs are a staple of life no matter what the economy is doing. However, according to Yardeni Research, drug retailers have a consensus estimated short-term earnings growth (STEG) rate of -6.9%. This means analysts are projecting drug retailer earnings to fall during the next 12 months. The five-year or long-term earnings growth (LTEG) rate is 0.9%. The group may appear to be at good valuation trading at 8.5 times forward earnings, but with negative earnings projections, the valuation may be misleading. Value investors should consult other metrics of evaluation before making any decisions.
EXTRAORDINARY EXPENSES: Analysts appear to be projecting better profit margins for the retailer industry group. Data from Yardeni showed that the S&P 500 Consumer Discretionary Retailing Industry Group has a STEG rate of 18.1%, while the short-term revenue growth (STRG) rate is just 7.7%. It’s difficult to grow earnings without growing revenue at least at a similar rate unless a company can cut expenses. Analysts may be projecting that input costs and potentially labor costs are going to decrease, which bodes well for the inflation picture.
The LTEG rate for the retailing group is 26.4%, which is relatively low compared to its 2020 peak that was nearly 40%. As of August 11, the group was trading at a forward P/E of 31.1.
Notable Calendar Items
Aug 16: Building permits, Housing Starts, and earnings from Walmart WMT, Home Depot HD, and TJX Companies TJX
Aug 17: Retail sales and earnings from Cisco CSCO, Lowe’s LOW, Analog Devices ADI, Target TGT, and Macy’s M
Aug 18: Philadelphia Fed Manufacturing Index, Existing Home Sales, and earnings from Estee Lauder EL, Applied Materials AMAT, NetEase NTES, and Ross Stores ROST
Aug 19: Earnings from Deere DE, Foot Locker FL, and Buckle BKE
Aug 22: Earnings from Palo Alto Networks PANW
TD Ameritrade® commentary for educational purposes only. Member SIPC.
Image sourced from Shutterstock
This post contains sponsored advertising content. This content is for informational purposes only and not intended to be investing advice.
Edge Rankings
Price Trend
© 2025 Benzinga.com. Benzinga does not provide investment advice. All rights reserved.
Trade confidently with insights and alerts from analyst ratings, free reports and breaking news that affects the stocks you care about.

