
The S&P 500 has been on a 610% bull run since the low of 2009, the longest bull run in history. This includes a 118% rise since the low of March 2020, following a 35% decline in the market in the early part of 2020 when the impact of CV19 sent waves around the globe.
The question is, how much further upside potential does the S&P 500 have?
As an investor, I am not in the gaming of making predictions. One of the first rules of good investing is to ignore opinions, including your own. They are regularly wrong, leading to losses, missed profits and/or opportunities.
It is far simpler to follow the mantra of the trend is your friend until the bend and to let price dictate how far the bulls are willing to go.
Even the impact of COVID-19 in early 2020 is now nothing more than a blip on the chart, showing how even a pandemic gets absorbed into the long-term trend.
Yet complacency is a killer of results. Identifying potential reversal points in the market is essential to locking in profits. Technical analysis and, particularly, support and resistance levels, are fantastic to determine a change in direction, but what if an asset is creating new all-time highs?
The answer is simple: round numbers!
See Also: 8 Trading Themes To Watch In 2022
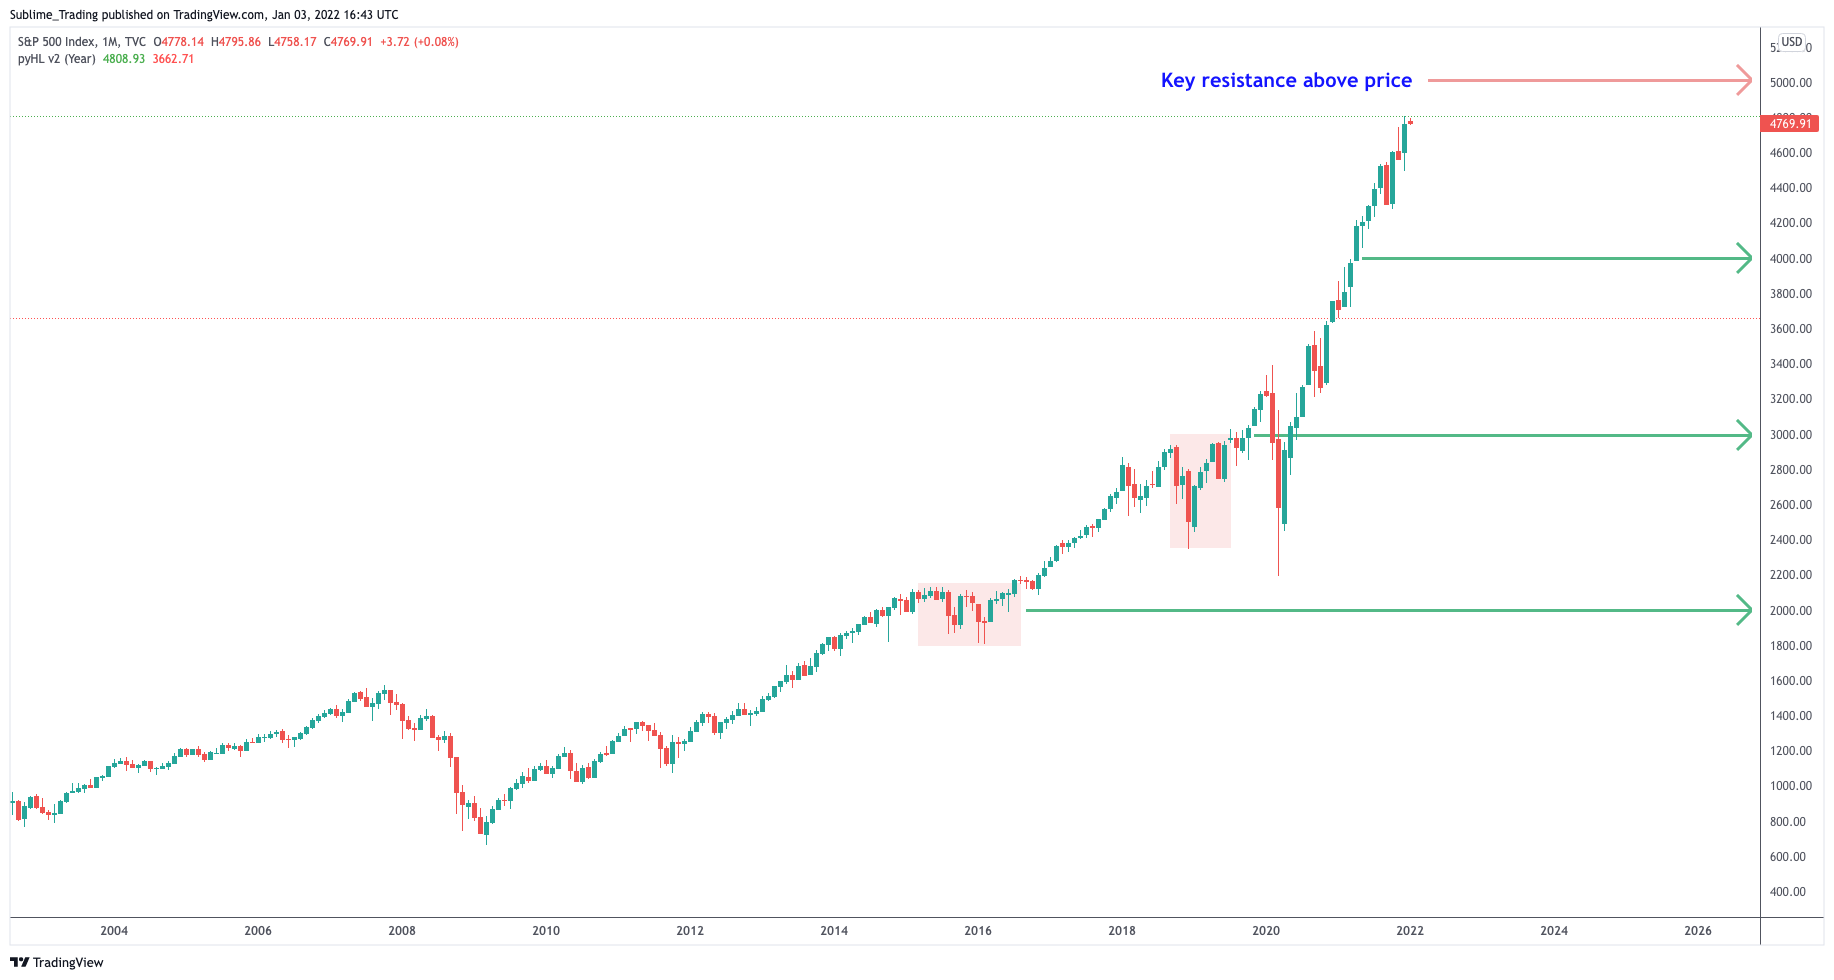
Let's break down the monthly timeframe of the S&P 500 in more detail. I have shared the chart below.
- Price consolidated between May 2015 and June 2016 at the 2,000 round number.
- Another consolidation between September 2018 and June 2019 at the 3,000 round number.
- Price made light work of the 4,000 round number in January 2021. Is this because of the momentum in the trend following the recovery from COVID-19? We will never know, and we don't need to know. Our priority is profit, not being right.
This leads us to where current price action is in relation to the 5,000 round number. A 5% rise in price will see the price testing the 5,000 round number as a significant area of resistance. There are three likely scenarios:
- Price moves right through, retests it as support and the bulls march on towards 6,000.
- Price finds an area of comfort and consolidates as it did at 2,000 and 3,000.
- Price reverses and creates a bear market as it did in 2000 and 2008.
Thinking in terms of probabilities and being prepared in advance for all three scenarios is what separates the good from the bad and the ugly. This is how I will manage my portfolio for each scenario:
- Continue to hold my long positions that have been in play since June 2020. I will then add compounds and new stocks that meet my high-probability criteria.
- Cut out of positions that hit my TSL. Hold onto positions that don't. Add new stocks that are outperforming the indices. Even when the indices are in consolidation, stocks will break out and trend to the upside.
- Cut out of all bullish stocks using my exit management defined in my trading plan. Reposition myself to the short the market when my high-probability checklist is met. As a side note, I last shorted the market in 2008.
I will leave it to the market forces to dictate what action to take and react accordingly.
Among several factors, it is often the art of applying patience and letting price dictate that catches people out. Investing is simple but not easy. The best techniques are simple to learn but consistently following a proven process is where many fall short.
As Leonardo da Vinci said, simplicity is the ultimate sophistication.
© 2025 Benzinga.com. Benzinga does not provide investment advice. All rights reserved.
Trade confidently with insights and alerts from analyst ratings, free reports and breaking news that affects the stocks you care about.

