In my last Benzinga post which you can read here, I analyzed the S&P 500 in relation to the daily 200 simple moving average (SMA) and how I use it to give me a bias to price action.
- If the price confirms a bull trend above the daily 200sma, I have a bullish bias and look for long opportunities.
- If the price confirms a bear trend below the daily 200sma, I have a bearish bias and look to short the market. The last time I shorted the market was in 2008. Since then, I have built my portfolio around the strongest performing bullish stocks.
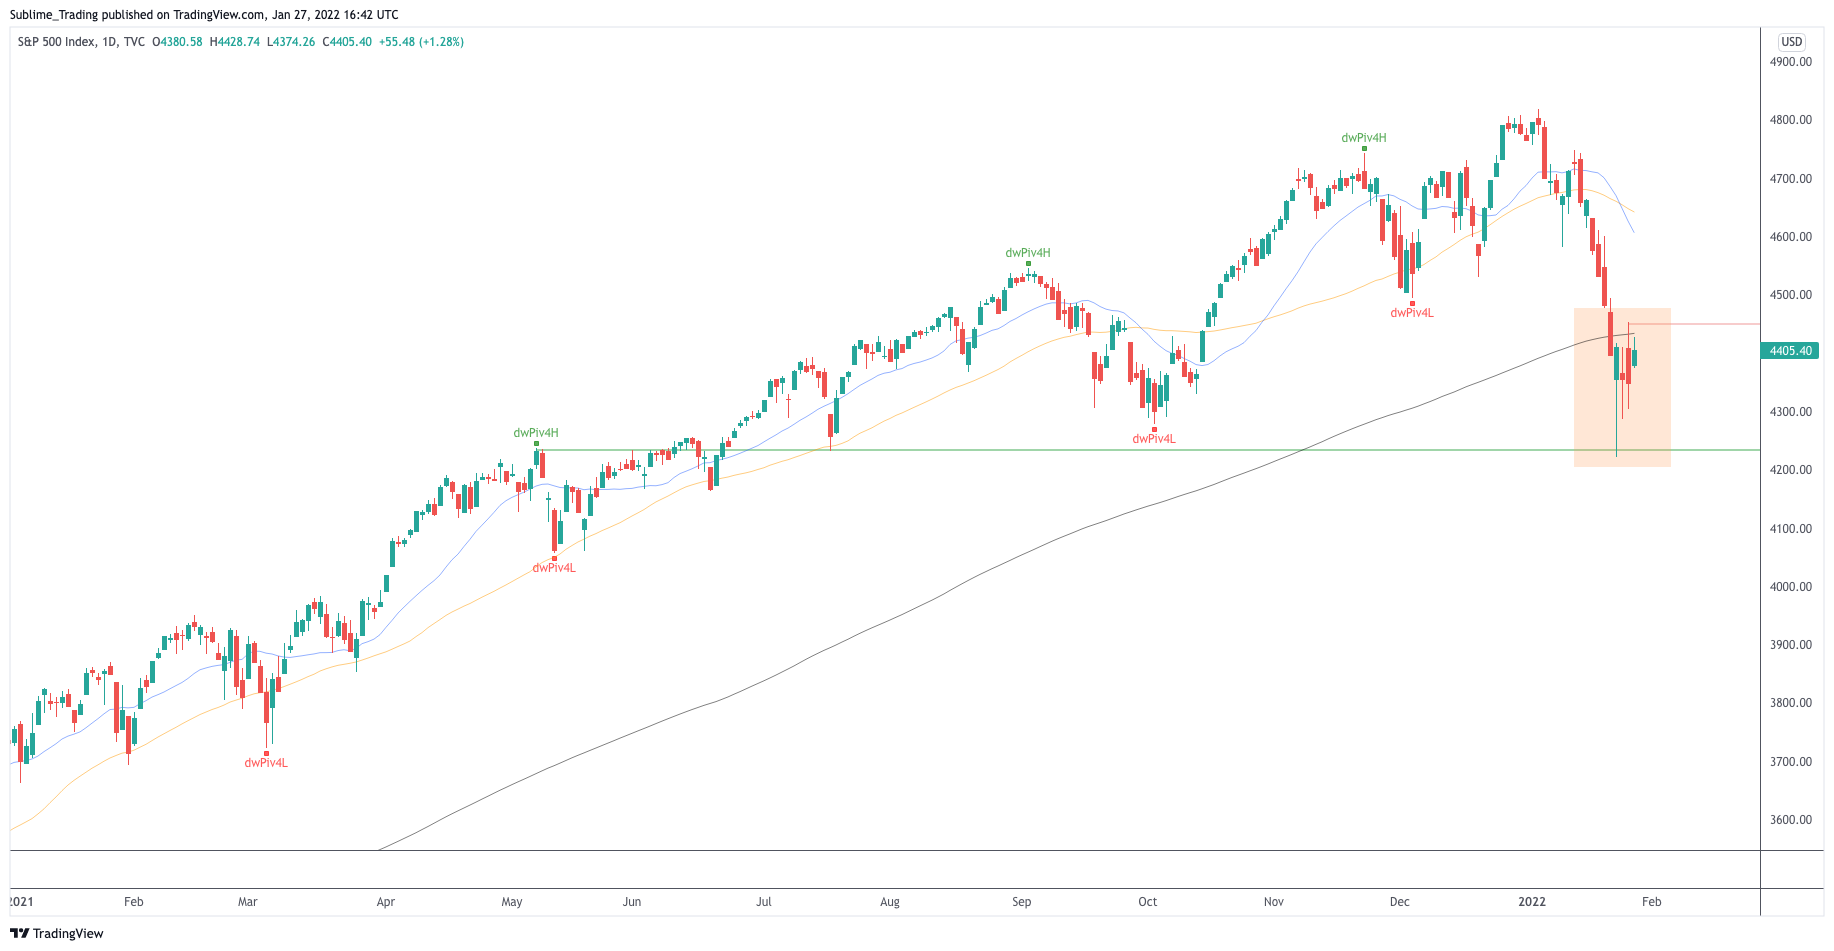
Since my previous post, the S&P 500 has broken through the daily 200sma, but it has yet to CONFIRM a bear trend. The price is now trading inside an area of consolidation, with a pivot level from May 2021 holding strong as support and the daily 200ma as resistance.
This is an area of uncertainty, as the price could go either way.
The daily 200sma could hold firm as resistance, forcing the price to break out to the downside and move toward the 4,000 round number.
We could also see the support level from May continue to hold firm, giving price the springboard to push back to the all-time high. As the overall trend since 2009 has been bullish, I favor a move back to the ATH.
This is not a certainty, just probabilities based on the logic that the trend is your friend until the bend at the end. This 12% decline in January, although significant, is not a bend until confirmed as one.
Below is the daily timeframe of the S&P 500.

Apple
Below is the daily timeframe of Apple. January has seen a 15% decline, taking the price to a pivot support level from September 2021. There has been a 5% increase since the low, keeping price above support.

Microsoft
Below is the daily timeframe of MSFT. A 20% decline since November 2021 has seen the price fall to the daily 200sma. 17% of this decline has been this month. The price has bounced 9% from the low, taking the price above the daily 200sma.

Nvidia
Below is the daily timeframe of NVDA. This stock has been the hardest hit of the three, with a drop of 40% since the high of November 2021. 32% of that drop has occurred this month. A 7% bounce from the low has taken price just above the daily 200sma.

What can we conclude from this?
If the S&P 500 can remain above the support level of May 2021 and work its way through the daily 200sma, then expect the support levels on the above stocks to hold firm.
If the S&P 500 forms a bearish flag formation below the daily 200sma, giving the price momentum to break through the May support level, then expect stocks to break through support.
In a bull trend, support levels are more robust than resistance levels, but the question remains, is this a top or simply an ugly pullback before a bull trend continuation?
We can only apply patience and let the price dictate.
For more on our technical analysis and trend-following techniques, check out our website at sublimetrading.io.
© 2024 Benzinga.com. Benzinga does not provide investment advice. All rights reserved.
Comments
Trade confidently with insights and alerts from analyst ratings, free reports and breaking news that affects the stocks you care about.