Zinger Key Points
- My overall stance is bullish given the bull trend the price has been in since 2009, but I always wait for the price to CONFIRM a bull trend continuation; I never PREDICT.
- Waiting for confirmation can be frustrating but gives you entry points with a much higher chance of returning a profit.
- Every week, our Whisper Index uncovers five overlooked stocks with big breakout potential. Get the latest picks today before they gain traction.
Establishing a bullish or bearish bias or an edge to an asset or a market is the foundation of sound investing. A lack of an edge is often where budding investors go wrong, making their decision more in line with gambling.
There is an expression that states that if you cannot define your edge, you do not have one. And if you do not have an edge, you will get eaten by someone who does.
Several ways to define an edge exist, with technical analysis being the simplest. Using charts to establish high-probability assets is a proven approach that goes back decades to the dawn of the financial markets used by some of the finest traders and investors.
One of the first indicators that you will find on a successful investor's charts is the 200sma. Depending on their holding period, this will appear on either the weekly or the daily timeframe.
If the price was trading above the 200sma, the bias was bullish, and traders looked for long opportunities.
If the price was trading below the 200sma, the bias was bearish, and traders looked for shorting opportunities.
They did not go against the bias. Institutions still use that logic today, as do trend followers like me with a holding period of 18 to 24 months.
Let's look into a brief history of the 200sma. Old school traders used to draw charts by hand and so were very particular about the information they displayed. As you can imagine, drawing charts manually would have been long and laborious, so it would have been essential to be efficient in their creation. Only the necessary data would have been collated and added to the charts.
As a side note, today, we are blessed to have software doing the hard work for us, allowing for less analysis and screen time and more time to make better investment decisions. Yet technology has led to the demise of quality analysis and investing and, in its place, given birth to cluttered charts and underperforming portfolios.
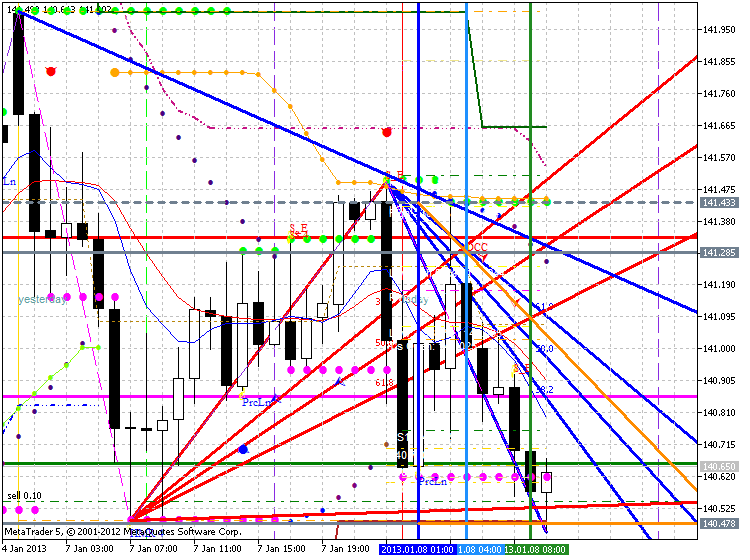
"Less is more" is a sophisticated approach to solid investing replaced by overtrading and the desire for quick riches. Below is an example of a chart of a modern-day trader. Good luck is all I have to say if you seek consistency.

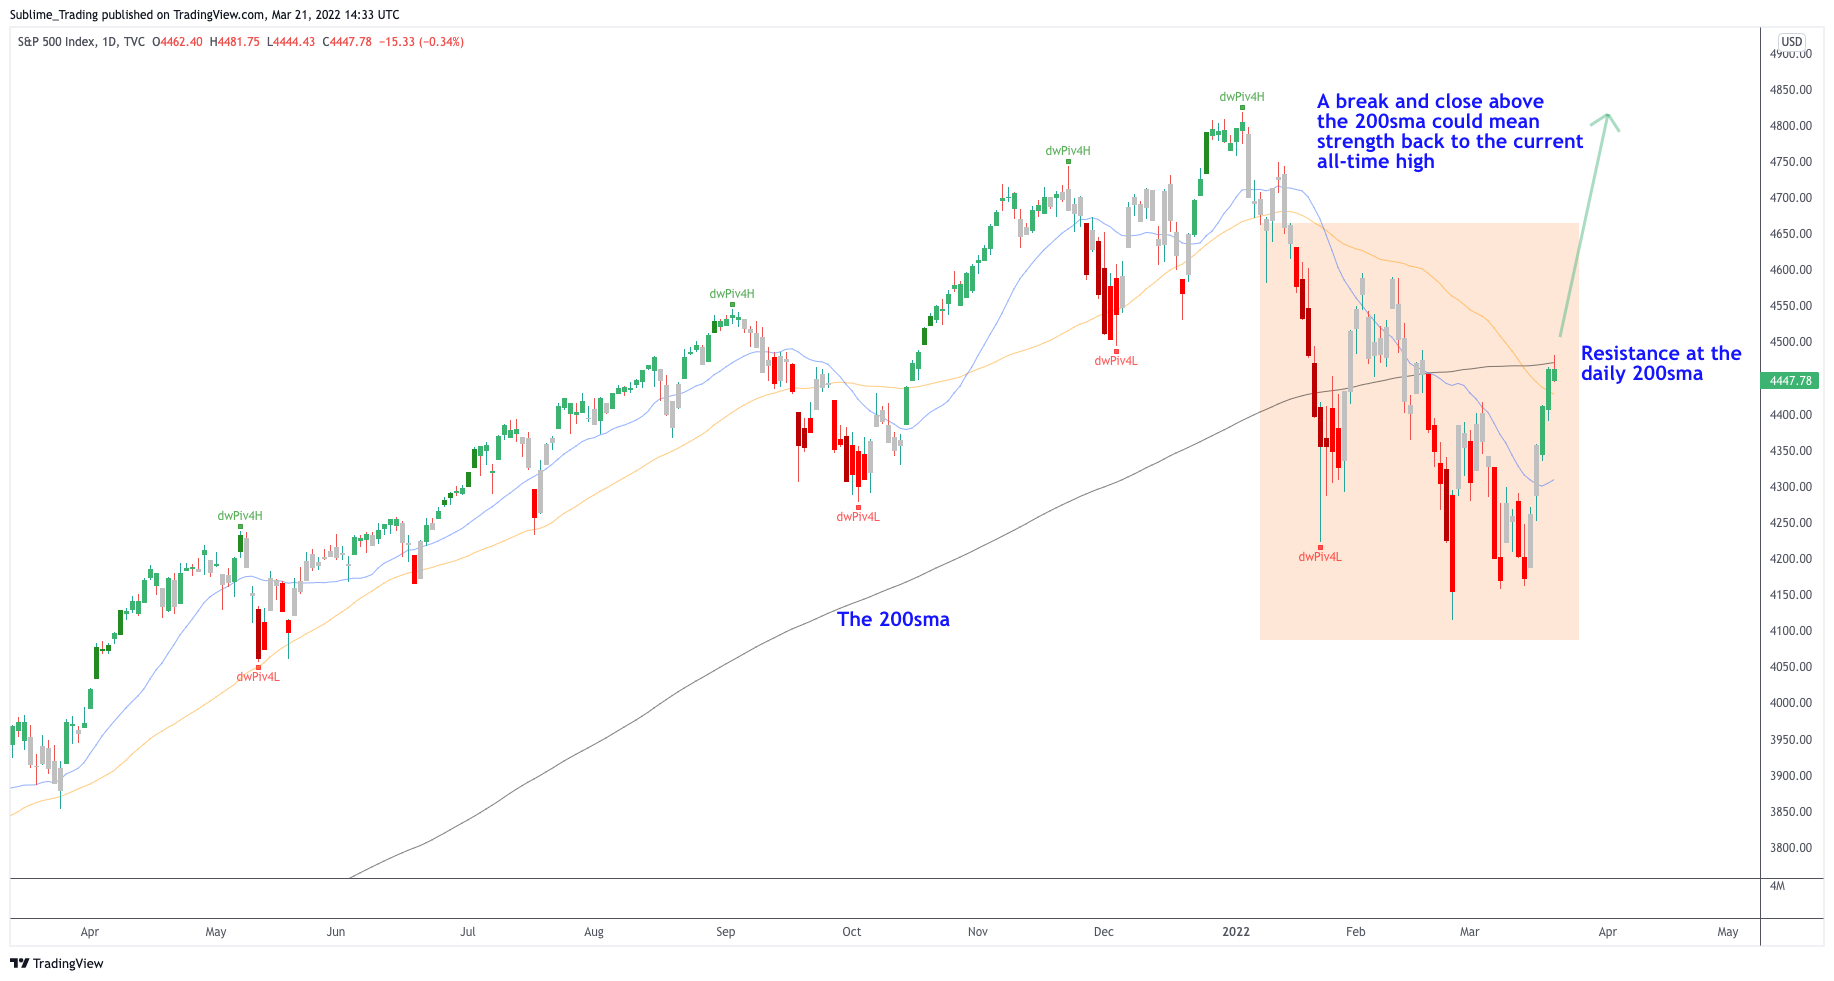
Below is the daily timeframe of the S&P 500. This is my primary indicator of the stock market.
If the price has a confirmed trend above the 200sma, I look to buy high-probability stocks.
If the price has a confirmed trend below the 200sma, I look to short high-probability stocks.

If the price on the S&P 500 is whipsawing above and below the daily 200sma as it has been for most of 2022, I tend to stand aside and focus on the forex and commodities markets.
Below is the daily timeframe of the S&P 500.
A 7.3% move to the upside last week has taken the price to the daily 200sma where it finds resistance at writing.
I will continue to apply patience until this major US. .index gives me a clear direction to the market. My overall stance is bullish given the bull trend the price has been in since 2009, but I always wait for the price to CONFIRM a bull trend continuation; I never PREDICT.
Waiting for confirmation can be frustrating but gives you entry points with a much higher chance of returning a profit. Predicting can be exciting and gives you the sense of being involved but leaves you open to fake breakouts and losses.
This is the difference between the investor mentality based on profit vs. loss and the gambler mentality based on winning vs. losing.
As mentioned above, less is more is an underappreciated approach .
The 200sma is undoubtedly one of the best indicators to establish the market's direction. It should not be used on its own but alongside the 50sma and the 20sma and significant support and resistance levels.
Split these indicators across the monthly, weekly and daily timeframes, and you can clearly define an edge within seconds of looking at a chart.
For now, there is no edge in the market, but a break and close above the daily 200sma will change that.
© 2025 Benzinga.com. Benzinga does not provide investment advice. All rights reserved.
Trade confidently with insights and alerts from analyst ratings, free reports and breaking news that affects the stocks you care about.