
Zinger Key Points
- Patience here is a virtue, as there is every possibility the price may weaken further.
- This is when I will look to short the market.
- Feel unsure about the market’s next move? Copy trade alerts from Matt Maley—a Wall Street veteran who consistently finds profits in volatile markets. Claim your 7-day free trial now.
It's been a tough 2022 so far for investors.
The S&P 500 declined by 25% at its peak. The IT sector has taken an absolute beating, with stocks like PayPal Holdings Inc PYPL falling 75%.
People are hesitant, and rightly so given the uncertainty, so the questions everybody wants answers to are: when is the right time to be buying stocks? Is now the right time? If not now, then when?
The answers to these questions are straightforward.
The challenge people face is learning to block out the noise and to transition from wanting social media clout to thinking and acting like investors.
You will never find these answers in Elon Musk's tweets or your favourite Facebook group compromised by those who put social media clout before profit and their future.
Looking To Charts For The Answer: The answers are found in the charts using the higher time frames of the monthly, weekly and daily charts to dictate your decisions and actions.
The logic is simple; if all three time frames are aligned, that is the time to start adding the right stocks into your portfolio. However, these three time frames can be both bullish and bearish.
If you are bullish aligned, you want to buy into stocks. If bearish aligned, you want to short the market as savvy investors did in 2000 and 2008. I started investing in 2007, and through good training, I was on the right side of the stock market to short it in 2008.
If there is no alignment, that is an environment to stand aside and apply patience. This crucial investor skill is regularly overlooked and underappreciated in the pursuit of quick riches and is why so many have poorly performing portfolios.
The S&P 500 has recovered by 7% in recent days, but the recovery is not significant enough to start buying. Further downside movement is still very much possible.
An industry-standard marker to determine a bullish or bearish bias to price action is the 200 simple moving average (sma) on both the weekly and the daily time frames.
- If the price is above both moving averages, we have a bullish bias.
- If the price is below both moving averages, we have a bearish bias.
- If they are not aligned, we stand aside.
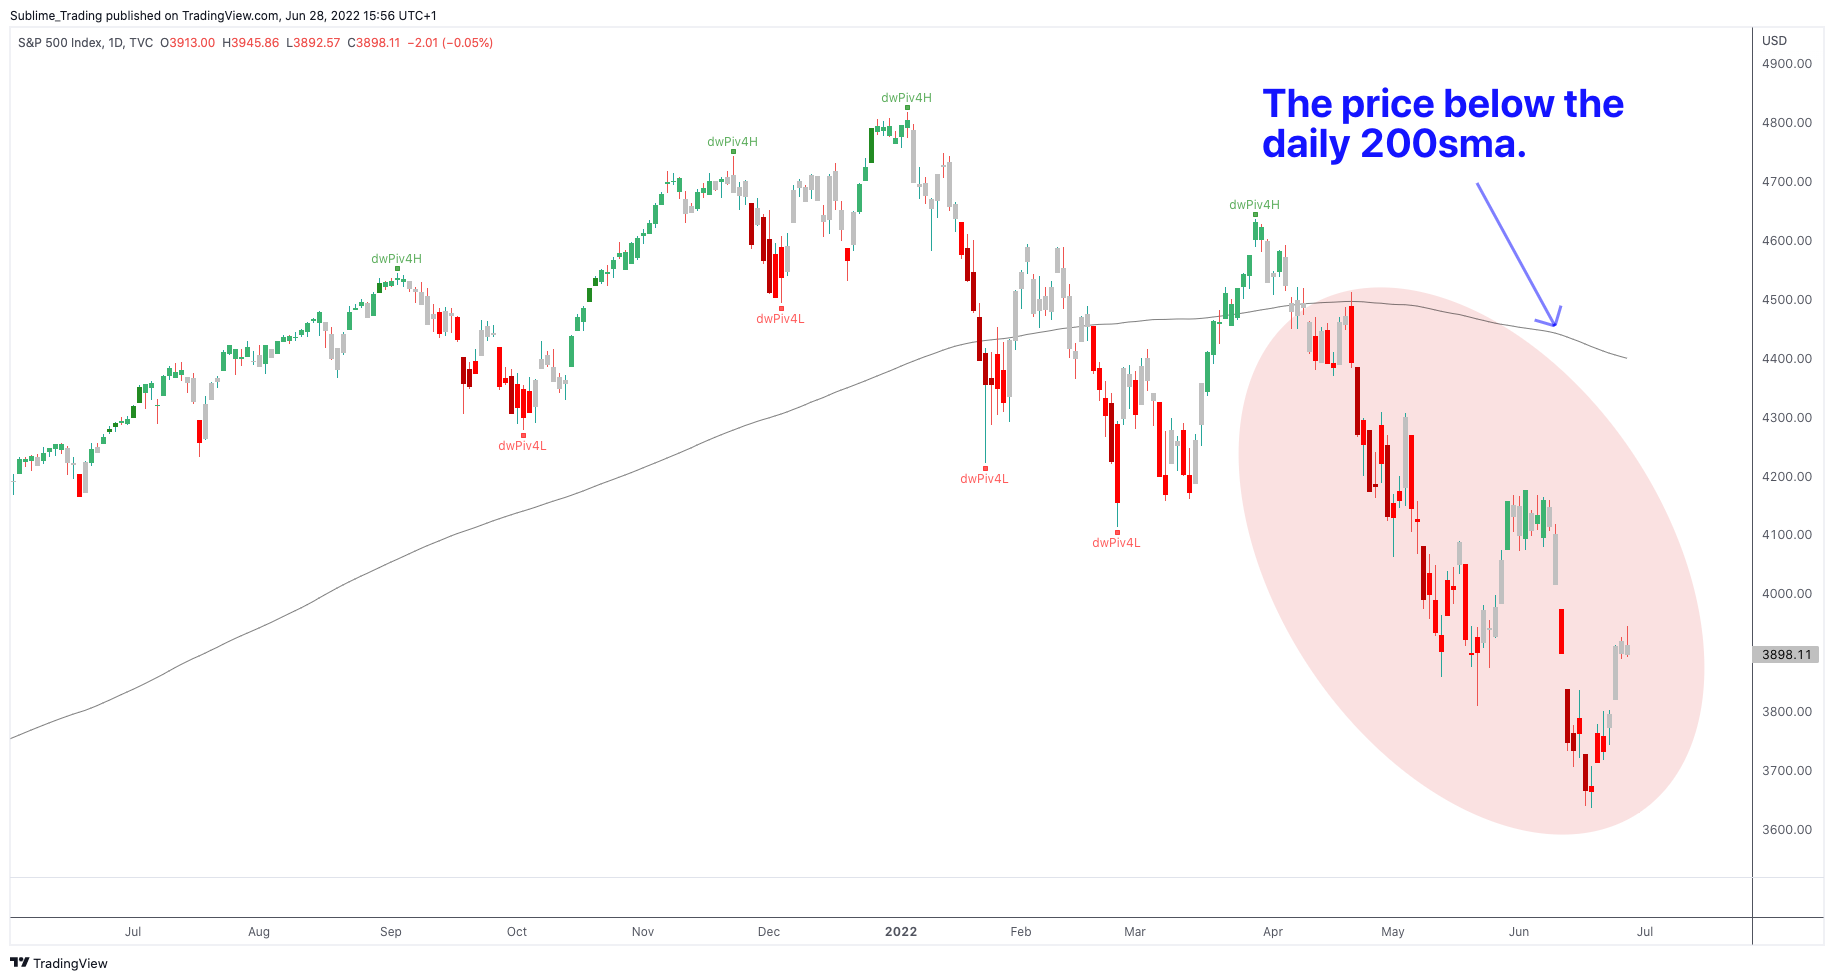
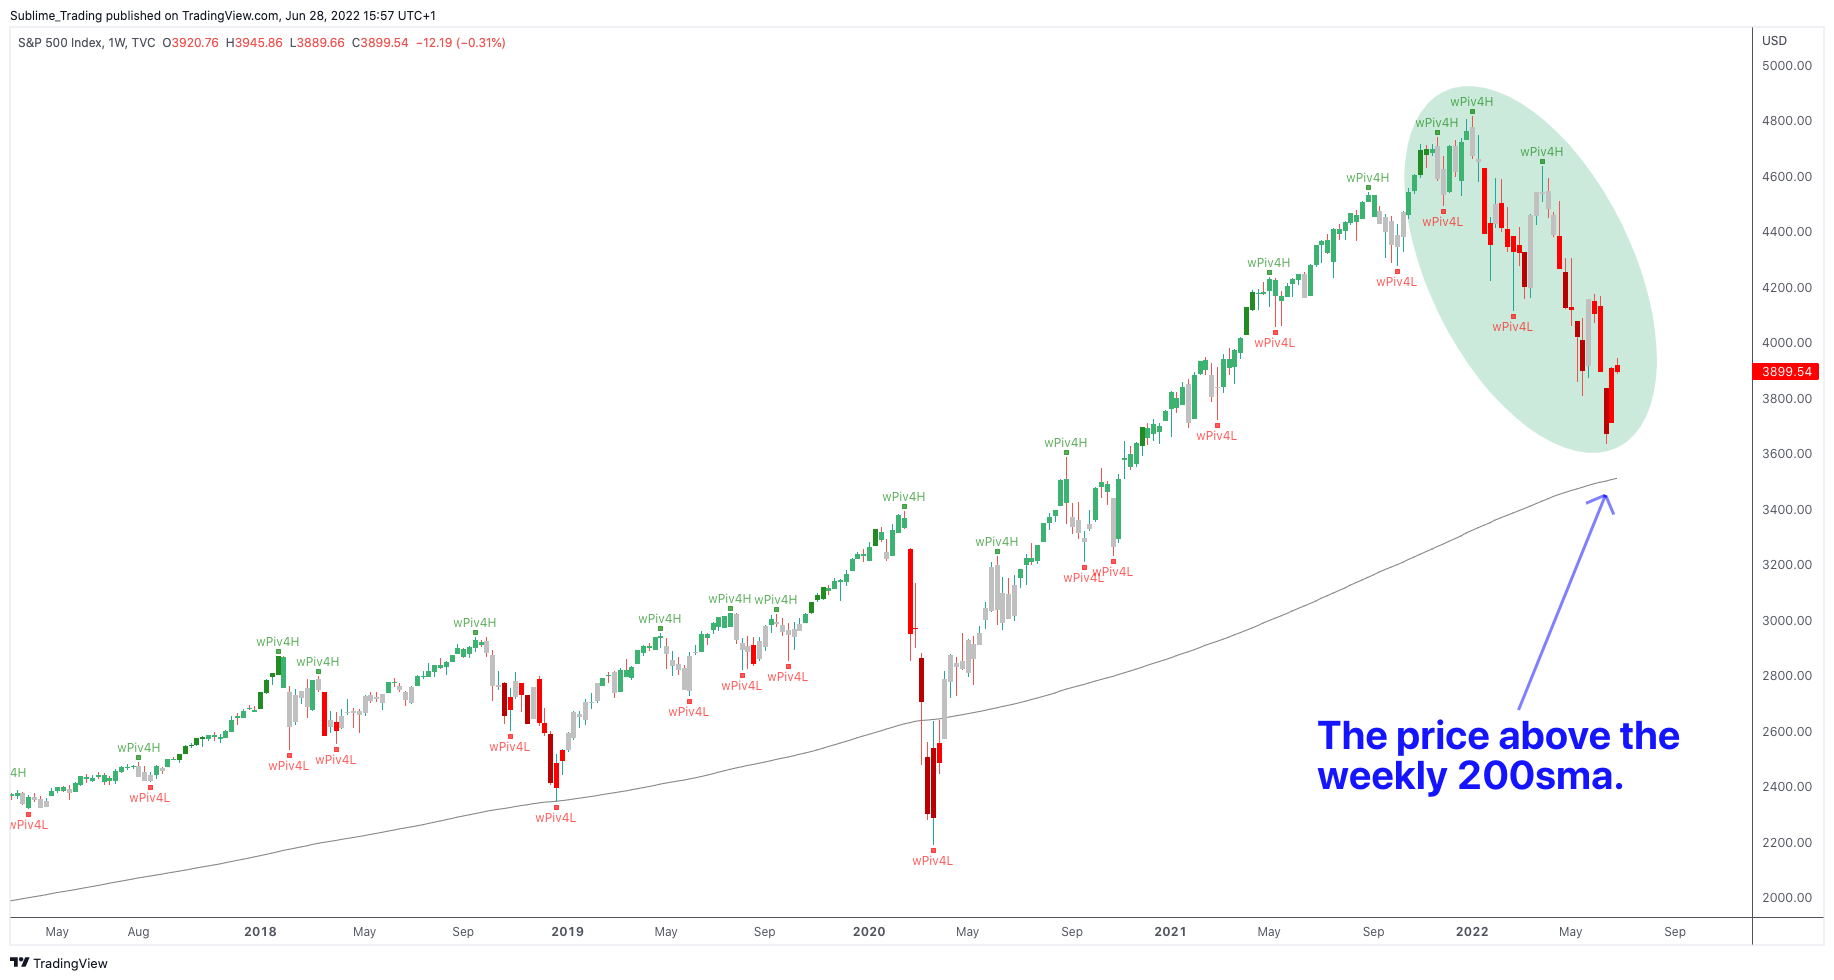
For the S&P 500, the price is above the weekly 200sma and below the daily 200sma. The bias is bullish on the weekly and bearish on the daily.
Below is the daily time frame.
Below is the weekly time frame.
The better choice in these market conditions is to stand aside. Once the price moves back above the daily 200sma, you have your indicator to start buying into stocks as the daily and weekly will be bullish aligned.
Patience here is a virtue, as there is every possibility the price may weaken further, taking the price below the weekly 200sma, when there will be bearish alignment across the weekly and daily time frames. This is when I will look to short the market.
For now, I will continue to stand aside and wait for the price to dictate a clear bias before adding more stocks to my portfolio.
Edge Rankings
Price Trend
© 2025 Benzinga.com. Benzinga does not provide investment advice. All rights reserved.
Trade confidently with insights and alerts from analyst ratings, free reports and breaking news that affects the stocks you care about.

