


Gold gets hammered
Gold futures for June delivery had dropped nearly 8 percent, trading at $1380.20 on the New York Comex intraday Monday. The gold-tracking ETFs SPDR Gold Shares (NYSEGLD) and iShares Gold Trust IAU were down 7.4% and 7.5%, respectively, on the day. Monday's bloodletting followed another awful day for gold investors on Friday; from Thursday's close, GLD and IAU investors were down about 11.5% as of intraday Monday.
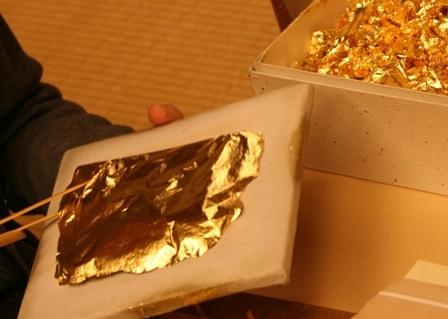
Gold is malleable -- are gold investors?
One of the physical properties of gold is that it is highly malleable, so gold can get hammered (into gold leaf, for example, which is pictured nearby) without breaking.
Whether gold investors will be as resilient if this steep correction continues remains to be seen, but the speed of this collapse is bound to be disconcerting for gold longs, considering that it has outpaced some of the more prominent, recent bearish outlooks on gold.
For example, in a report released on April 2nd ("The End Of The Gold Era?"), analysts at Societe Generale SCGLY predicted gold could trade at $1375 per ounce by year end, with an average price of $1500 for 2013. More recently, on April 11th, analysts at Goldman Sachs GS issued 6 month and 12 month target gold prices of $1490 and $1390, respectively. Gold has dived faster in the last two trading days than even these bearish institutional analysts anticipated.
Downside Protection And Malleability
As we noted in a post as gold was heading toward its peak in 2011 ("Gold Goes Parabolic, Hedging Costs Rise"), one of the advantages of being hedged is that it obviates the need to panic or run for the exits:
If you're hedged when the next correction in gold hits, you'll have the breathing room to consider whether that correction is analogous to 1980's crash from gold's generational peak or to 2008's sharp, though temporary, correction.
Remember that in 2008 gold fell to a low of $712.50 per ounce, after having peaked at over $1,011 per ounce earlier in the year. A gold investor who had been hedged could have, if he were still bullish on gold at that point, sold his hedges and used the proceeds to increase his position in gold.
Malleability works as a metaphor here, since a hedged gold investor's portfolio could potentially handle getting hammered by a gold correction, more so than an unhedged portfolio. Consider, for example the hypothetical gold investor we mentioned in a post earlier this year ("Two Inexpensive Ways To Hedge GLD").
Hedging a gold position on January 25th
In the article mentioned above, we gave examples of how a hypothetical investor with a 1000 shares of GLD could have used optimal puts* or an optimal collar** to hedge against a greater-than-10% drop between then and late June. This was the optimal put hedge:
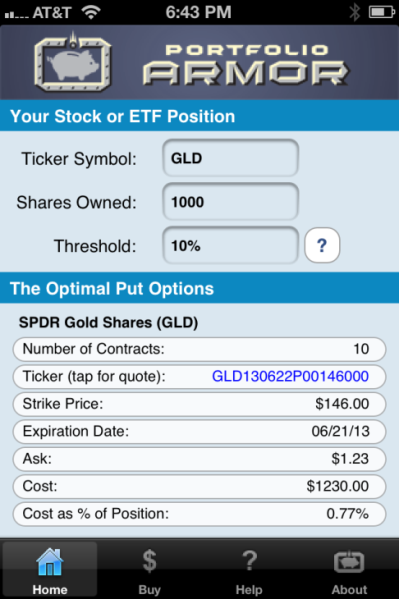
As you can see at the bottom of the screen capture above, the cost of this put protection, as a percentage of position value, was quite inexpensive: only 0.77%. Note that, to be conservative, the cost here was calculated using the ask price of the optimal puts. In practice, an investor can often buy puts for a lower price, i.e., some price between the bid and ask.
How GLD Has Performed Since We Posted That Hedge
Not well. GLD has declined about 17% since, as of intra-day Monday.
How Those Optimal Puts Reacted To GLD's Drop
The screen capture below shows how those optimal puts we showed back in January reacted to GLD's drop as of intra-day Monday.

As you can see in the screen capture above, those puts jumped more than 166% intra-day Monday when had GLD dropped 7.6% by the same time. This is an example of the nonlinearity of options, which enables a small dollar amount of options to protect a much larger position in an underlying security, such as GLD.
How That Hedge Cushioned GLD's Drop
GLD closed at $160.65 on January 25th. An investor who owned 1000 shares and bought the optimal puts to hedge it against a >10% drop that day had $160,650 in GLD and an outlay of $1,230 on the puts (again, assuming, conservatively, that he bought the puts at the ask). $160,650 + $1,230 = $161,880.
As of intra-day Monday, GLD traded at $133.15, and those puts traded at $15.20. As of intra-day Monday, our investor's GLD shares were worth $133,150 and his put options were worth $15,200: $133,150 + $15,200 = $148,350.
So, although GLD dropped about 17% from January 25th's close to intra-day Monday, April 15th, an investor who bought those puts on January 25th was only down about 8.4% on his combined hedge + underlying stock position over the same time frame.
More Protection Than Promised
Recall that the optimal put hedge was designed to protect against a greater-than-10% decline. Because these had time value in addition to intrinsic value as of April 12th's close, they offered more protection than that.
Inexpensive To Hedge For Most Of This Year
As I noted on the Index Investing Show two weeks ago (starting at about 25:28 of the recording at the link), despite its poor performance from the beginning of the year until then, it was actually less expensive to hedge GLD than it was to hedge SPY.
Hedging GLD Now
It's still possible to hedge GLD, but it's not as cheap to do so. The screen capture below shows the optimal puts, as of intraday Monday, to hedge 1000 shares of GLD against another, greater-than-10% drop by September 20th.
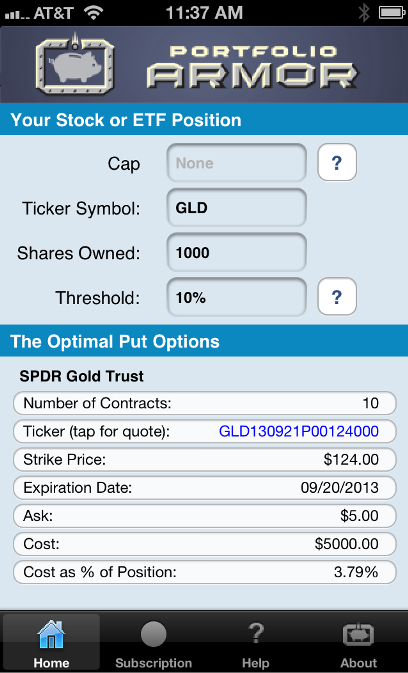
As you can see at the bottom of the screen capture above, the cost of this protection, as a percentage of position value, was 3.79% - nearly 5x as expensive as it was to hedge against the same percentage drop back in January.
A Less Expensive Way Of Hedging GLD Now
An investor looking to limit his downside in GLD to 10% over the next several months, but also willing to cap his potential upside by 10% over the same time frame, could have used the optimal collar** below to hedge intraday Monday.

As you can see at the bottom of the screen capture above, the net cost of this collar was 0.68% of position value.
*Optimal puts are the ones that will give you the level of protection you want at the lowest possible cost. Portfolio Armor uses an algorithm developed by a finance Ph.D to sort through and analyze all of the available puts for your stocks and ETFs, scanning for the optimal ones.
**Optimal collars are the ones that will give you the level of protection you want at the lowest net cost, while not limiting your potential upside by more than you specify. The algorithm to scan for optimal collars was developed in conjunction with a post-doctoral fellow in the financial engineering department at Princeton University. The screen captures of optimal hedges above come from the Portfolio Armor iOS app.
© 2025 Benzinga.com. Benzinga does not provide investment advice. All rights reserved.
Trade confidently with insights and alerts from analyst ratings, free reports and breaking news that affects the stocks you care about.

